With a lot of help from others, Umran and I have been tracking the new Green Edge road cycling team during their training camp at the AIS and Thredbo and improving live tracking technology as they train. Rides were tracked in Canberra and Thredbo. Today the team rides to Parliament and the Minister for Sport, Mark Arbib will ride along with the team. We may get the opportunity to track him. Live tracking technology can provide detailed information to a race audience and if a whole field is tracked, offers the potential for live web telecasts of races. Tracking during training provides feedback to coaches to enable them to analyse performance while training is taking place. Using an amalgam of technologies including Google My Tracks, Map My Tracks, our own Android app and wireless sensors we can provide cyclist position, speed, heart rate, power and cadence.
Update
We did get to track the minister and it was fun watching. In retrospect I wish I'd driven down to parliament house to watch them arrive. From the AIS to parliament house we are tracking Mark riding with the Green Edge team, ACTAS, the ACT Sports minister Andrew Bar and some other riders I didn't recognise. Mark proceeds directly to the parliamentary forecourt while the other cyclists (at least the ones we tracked) do another lap around parliament house before joining. Rebecca Wiasak, who I haven't seen since the camp, was there with ACTAS and carried a tracker as well. At the parliamentary forecourt Mark Arbib's tracker was retrieved and the subsequent path was the team car.
MathJax
Wednesday, December 7, 2011
Friday, November 25, 2011
Final Five At The AIS Womens Road Cycling Camp
Friday
The AIS Women's Road Cycling Camp is nearly over with only two days and five riders remaining. Today we are tracking a ride from of about 100km that finishes at the NSW/ACT border. The individual riders are:
One rider, R. Neylan, has an SRM Power Control 7 so you can see power data for her.
Saturday
The camp finishes today with the Canberra Cycling Club Lookout Hill event. See them grouped here .
The AIS Women's Road Cycling Camp is nearly over with only two days and five riders remaining. Today we are tracking a ride from of about 100km that finishes at the NSW/ACT border. The individual riders are:
| Rider | Screen Name |
|---|---|
| G. Sulzberger | livemonitor.temp03 |
| S. Noonan | livemonitor.temp04 |
| G. Elvin | livemonitor.temp01 |
| R. Neylan | livemonitor.temp02 |
| L. Jacobs | livemonitor.temp05 |
Saturday
The camp finishes today with the Canberra Cycling Club Lookout Hill event. See them grouped here .
Saturday, November 19, 2011
Tough Times At The AIS Women's Road Cycling Camp
There was a culling event yesterday and it was a "Survivor" like scenario where the women check out of their hotel and attend the event with their bags packed. Those that remain face another tough week and more culls until the the last four are offered cycling scholarships as their prize. Some of the original twenty one didn't get this far, one with a broken collar bone. Presumably Cadel Evans benefited from his scholarship but I'm wondering whether it's worth the effort because it looks hellishly difficult to get one. Usually they don't know until the morning what they will endure that day but they know about the cull which I saw was causing anguish. In one exercise to maximise psychological pressure, torture machines, otherwise known as stationary bicycles, are placed in a line so sufferers can observe their colleagues. No one wants to be the first to collapse and some want to be the last. The pain is obvious and when one person performed as well as anyone has in the last twenty years, she wasn't told. She too was concerned about the cull and if she knew her result she wouldn't be. I stayed away from the cull but will look for the survivor list today.
We are testing live tracking, aiming to figure out how to use it as a training aid. All test rides for the camp are grouped. It was a last minute invitation to test at the camp due to positive feedback at two earlier presentations. The late decision precluded preparation.
Friday Pursuits
Friday was a pursuit with a morning session swapping handsets between riders. Live data was provided from one handset. Two riders were tracked on the way home. The afternoon was a repeat of the morning with live, corresponding uploaded data and earlier uploaded data from one handset and live, corresponding uploaded data and earlier uploaded data from a second handset. We missed some change overs because recovering a handset and passing it to the next rider breaks the flow. It also requires records of who is riding when. Handsets aren't expensive so a handset per rider is the way forward. We are purchasing ten more for future testing. You don't want to interfere with the flow of the session therefore starting the handset early in the day and stopping at the end is better. Remote control of the app through a web interface by a third party would be better again. This would enable battery management and sessions to be broken down into separate activities live without bothering the athlete.

Dave Martin mentioned it would be useful to use the tracking data for recording times, particularly where there are a lot of riders. We have a three second resolution in the live data and one second in the on device My Tracks record so timing will not be high resolution but interpolation may get timing a bit better than one second. Using the one second data, pursuit times for a few riders were estimated as:-
To automate timing a start and stop line would be useful and the timing between the two could be calculated automatically.
Rider 3 recorded power data on the ride back from Queanbeyan and another cyclist tracked position only.
Saturday Hill Climb
On the morning travel to Black mountain Rider 17 and Rider 14 carried a handset and Rider 14 provided power data from a PCS 7. Two riders in the morning group carried a handset up Black Mountain and two in the afternoon. Another rider didn't want to carry the extra 136 grams, prompting the question of whether that was due to the idea of extra weight or whether 136 grams really is too much? The hill climb needs a lot of staff at the top to get individual arrival times in case of bunching so GPS timing here might be useful. In this case it was a rolling start so knowledge of the timing start point is required for a timing estimate. The morning riders were Rider 17 finishing eigth and Rider 13 finishing sixth. Neither had a PCS 7 but another rider did so I tried pairing both units to Rider14's PCS 7 and you will see the same power data on both graphs. When discussing live tracking some people express the view that live data shouldn't be shared as it gives your opponent an advantage, however if PCS 7 telemetry is turned on anyone who wants can pick it up if they are close enough. The field strung out and once the distance was too great the radio signal and therefore power data was lost. On this occasion there was a single PCS 7 so it was easy to connect to the right one but the current My Tracks pairing algorithm of connect to the first unit it can find will be unsuitable in an environment of multiple PCS 7s. Also there is also only 1000 possible ANT + addresses for a PCS 7 so in a big event its likely multiple units will use the same address and interfere with each other.


One volunteer and Rider 3 carried the handset in the afternoon with Rider 3 recording power data. The afternoon riders came in close together with Rider 3 fifth. On the descent the riders had to get to the bottom as quickly as possible but they faced culling if they crossed the white line or crashed.
Sunday Race
On Sunday there was a three hour race to Yass and another back in the rain with some dirt sections. Riders were too spread out for a peloton. These are expensive bikes which I thought were fragile and while they didn't look good on ruts or in the mud with their thin racing tyres, nothing broke. Going downhill fast in the mud looked scary and I saw one rider drop back from her more courageous colleagues in fear. No one complained though, and the winner from Tasmania said. "It suits me. Its like home".
We expected loss of mobile reception along this route so Umran spent Saturday improving the logic for dealing with the loss of connectivity. There wasn't time to install this on Rider 3's handset on Sunday morning. Rider 3's handset got a server error shortly after setting off so the app stopped sending. This meant loss of live data but the data is still captured on the handset by My Tracks. Rider 3 forgot her PCS 7, so I picked it up and delivered it to her half way to Yass. This allowed us to get live power data for most of the way back, losing the live feed when the mapmytracks server shut down for maintenance. Again the data was still available on the handset. Rider 14 carried the Xperia ARC handset with the software upgrade and it provided live on the way out until we lost the GPS signal and all the way back. The power data is good but the GPS data was patchy so we checked the live data against the handset data file on the way out and back giving the same result and showing the problem is this handset's poor quality GPS. It provides an example of the necessity to test handsets. This is a much newer and more expensive handset than the X10 mini pro, but for this application, inferior. For anyone who's reading this in Australia and wants an X10 mini pro they are being advertised at Target for $99 sim locked to Telstra between 24 Nov and 30 Nov 2011. From an observers point of view the loss of mobile reception is disconcerting because they see the rider stationary for a long period followed by very fast travel when the mobile reception returns. The new software dealt better with loss of connectivity so I'll upgrade the market app in the next few days.
There was a 15 minute break at Yass which allowed for a battery change. This takes about 3 minutes on the X10 mini pro and probably double that on the Xperia ARC as it has a slow boot. Battery changes are quite practical in a break but it ought to be a support person that does it as the athletes are too tired to fiddle. This three hour event each way provided a good opportunity to test battery life. Both handsets lasted the distance both ways. The Xperia X10 mini pro had at most another half hour of battery life remaining and the Xperia ARC was a bit below half in each direction.


General Observations
Live tracking would be more useful with more riders so Dave Martin suggested at the Friday night debrief installing the Iphone app to the 13 Iphone owners and our app to the Android owner. Nobody did, perhaps because everyone is already tired and its too much bother, providing further evidence that tracking has to be low effort to get buy in and people need to be familiar with the technology prior to an event. We've seen teams tracked at the past two Tour de France races, but not the field. We need to see the full field on the one map to understand an event so it would be great to do an event with universal tracking. This is a weakness in the SRM model where only riders with SRM telemetry can connect to SRM Live. Its more valuable for everyone to see the data from other riders, even if its only position for those without power meters, so live tracking systems ought to work with a wide range of equipment. The majority of the riders on the camp already had a suitable smart phone, so we could have done it. Also, even at this level there were only 3 out of the 21 riders with PCS 7s. Not everyone with a power meter had a PCS 7 so widespread use also needs My Tracks to connect to more sensors including directly to power meters which Google is working on. GPS accuracy is currently critical. A handset with poor GPS like, the Xperia ARC or an environment unsuitable for GPS will give poor speed and distance accuracy. One solution would be to use odometry for the speed and distance measurements and the GPS, for location only. The mapmytracks server goes down in the middle of every night in Britain, where the developers are based, for an hour or so of maintenance. This probably doesn't bother people there but it's a significant inconvenience in Australia, where it is mid afternoon, even though we managed to record across the shut down with Saturday'software upgrade.
Summary
We are testing live tracking, aiming to figure out how to use it as a training aid. All test rides for the camp are grouped. It was a last minute invitation to test at the camp due to positive feedback at two earlier presentations. The late decision precluded preparation.
Friday Pursuits
Friday was a pursuit with a morning session swapping handsets between riders. Live data was provided from one handset. Two riders were tracked on the way home. The afternoon was a repeat of the morning with live, corresponding uploaded data and earlier uploaded data from one handset and live, corresponding uploaded data and earlier uploaded data from a second handset. We missed some change overs because recovering a handset and passing it to the next rider breaks the flow. It also requires records of who is riding when. Handsets aren't expensive so a handset per rider is the way forward. We are purchasing ten more for future testing. You don't want to interfere with the flow of the session therefore starting the handset early in the day and stopping at the end is better. Remote control of the app through a web interface by a third party would be better again. This would enable battery management and sessions to be broken down into separate activities live without bothering the athlete.
Dave Martin mentioned it would be useful to use the tracking data for recording times, particularly where there are a lot of riders. We have a three second resolution in the live data and one second in the on device My Tracks record so timing will not be high resolution but interpolation may get timing a bit better than one second. Using the one second data, pursuit times for a few riders were estimated as:-
| Lap | Rider 2 | Rider 4 | Rider 5 | Rider 7 |
|---|---|---|---|---|
| 1 | 39.5 | 40 | 39.5 | 38.5 |
| 2 | 39.5 | 38 | 38.5 | 38.5 |
| 3 | 40 | 39 | 39.5 | 37.5 |
| 4 | 39 | 38.5 | 38.5 | 37.5 |
| 5 | 38 | 38.5 | 39 | 37.5 |
| 6 | 38 | 38.5 | 39 | 37 |
| Overall Time | 273 | 272.5 | 275 | 268 |
| Measured Distance (km) | 3.36 | 3.30 | 3.34 | 3.28 |
Rider 3 recorded power data on the ride back from Queanbeyan and another cyclist tracked position only.
Saturday Hill Climb
On the morning travel to Black mountain Rider 17 and Rider 14 carried a handset and Rider 14 provided power data from a PCS 7. Two riders in the morning group carried a handset up Black Mountain and two in the afternoon. Another rider didn't want to carry the extra 136 grams, prompting the question of whether that was due to the idea of extra weight or whether 136 grams really is too much? The hill climb needs a lot of staff at the top to get individual arrival times in case of bunching so GPS timing here might be useful. In this case it was a rolling start so knowledge of the timing start point is required for a timing estimate. The morning riders were Rider 17 finishing eigth and Rider 13 finishing sixth. Neither had a PCS 7 but another rider did so I tried pairing both units to Rider14's PCS 7 and you will see the same power data on both graphs. When discussing live tracking some people express the view that live data shouldn't be shared as it gives your opponent an advantage, however if PCS 7 telemetry is turned on anyone who wants can pick it up if they are close enough. The field strung out and once the distance was too great the radio signal and therefore power data was lost. On this occasion there was a single PCS 7 so it was easy to connect to the right one but the current My Tracks pairing algorithm of connect to the first unit it can find will be unsuitable in an environment of multiple PCS 7s. Also there is also only 1000 possible ANT + addresses for a PCS 7 so in a big event its likely multiple units will use the same address and interfere with each other.
One volunteer and Rider 3 carried the handset in the afternoon with Rider 3 recording power data. The afternoon riders came in close together with Rider 3 fifth. On the descent the riders had to get to the bottom as quickly as possible but they faced culling if they crossed the white line or crashed.
Sunday Race
On Sunday there was a three hour race to Yass and another back in the rain with some dirt sections. Riders were too spread out for a peloton. These are expensive bikes which I thought were fragile and while they didn't look good on ruts or in the mud with their thin racing tyres, nothing broke. Going downhill fast in the mud looked scary and I saw one rider drop back from her more courageous colleagues in fear. No one complained though, and the winner from Tasmania said. "It suits me. Its like home".
We expected loss of mobile reception along this route so Umran spent Saturday improving the logic for dealing with the loss of connectivity. There wasn't time to install this on Rider 3's handset on Sunday morning. Rider 3's handset got a server error shortly after setting off so the app stopped sending. This meant loss of live data but the data is still captured on the handset by My Tracks. Rider 3 forgot her PCS 7, so I picked it up and delivered it to her half way to Yass. This allowed us to get live power data for most of the way back, losing the live feed when the mapmytracks server shut down for maintenance. Again the data was still available on the handset. Rider 14 carried the Xperia ARC handset with the software upgrade and it provided live on the way out until we lost the GPS signal and all the way back. The power data is good but the GPS data was patchy so we checked the live data against the handset data file on the way out and back giving the same result and showing the problem is this handset's poor quality GPS. It provides an example of the necessity to test handsets. This is a much newer and more expensive handset than the X10 mini pro, but for this application, inferior. For anyone who's reading this in Australia and wants an X10 mini pro they are being advertised at Target for $99 sim locked to Telstra between 24 Nov and 30 Nov 2011. From an observers point of view the loss of mobile reception is disconcerting because they see the rider stationary for a long period followed by very fast travel when the mobile reception returns. The new software dealt better with loss of connectivity so I'll upgrade the market app in the next few days.
There was a 15 minute break at Yass which allowed for a battery change. This takes about 3 minutes on the X10 mini pro and probably double that on the Xperia ARC as it has a slow boot. Battery changes are quite practical in a break but it ought to be a support person that does it as the athletes are too tired to fiddle. This three hour event each way provided a good opportunity to test battery life. Both handsets lasted the distance both ways. The Xperia X10 mini pro had at most another half hour of battery life remaining and the Xperia ARC was a bit below half in each direction.
General Observations
Live tracking would be more useful with more riders so Dave Martin suggested at the Friday night debrief installing the Iphone app to the 13 Iphone owners and our app to the Android owner. Nobody did, perhaps because everyone is already tired and its too much bother, providing further evidence that tracking has to be low effort to get buy in and people need to be familiar with the technology prior to an event. We've seen teams tracked at the past two Tour de France races, but not the field. We need to see the full field on the one map to understand an event so it would be great to do an event with universal tracking. This is a weakness in the SRM model where only riders with SRM telemetry can connect to SRM Live. Its more valuable for everyone to see the data from other riders, even if its only position for those without power meters, so live tracking systems ought to work with a wide range of equipment. The majority of the riders on the camp already had a suitable smart phone, so we could have done it. Also, even at this level there were only 3 out of the 21 riders with PCS 7s. Not everyone with a power meter had a PCS 7 so widespread use also needs My Tracks to connect to more sensors including directly to power meters which Google is working on. GPS accuracy is currently critical. A handset with poor GPS like, the Xperia ARC or an environment unsuitable for GPS will give poor speed and distance accuracy. One solution would be to use odometry for the speed and distance measurements and the GPS, for location only. The mapmytracks server goes down in the middle of every night in Britain, where the developers are based, for an hour or so of maintenance. This probably doesn't bother people there but it's a significant inconvenience in Australia, where it is mid afternoon, even though we managed to record across the shut down with Saturday'software upgrade.
Summary
- We need to track everyone in an event on the same map to understand what is going on.
- Handsets need to be tested prior to use as newer and more expensive is not always better.
- Handsets should be associated with riders not swapped between riders or associated with bikes.
- Battery life is not an issue up to 3 hours with the X10 mini pro but needs thought for longer events.
- Riders need to be familiar with using tracking prior to an event.
- Effort to set up and go needs to be minimal, ideally nil. Its not practical for a rider to manage the technology during an event.
- Remote control of tracking would be useful for separating activities and managing battery life.Tracking systems need to connect to a variety of devices including directly to power meters and heart rate monitors.
- The daily mapmytracks server shut down is a significant inconvenience.
Sunday, November 13, 2011
Is Live Bicycle Tracking Going To Have A Major Impact On Cycling?
We have been trialling live bicycle tracking for a while now and last week I got the opportunity to present our work at the Applied Physiology Conference at the Australian Institute of Sport (AIS). This is an annual gathering of people providing technical and science support for coaches and athletes. On the opening Monday the participants, who were mostly young fit and intimidating, seemed in widespread agreement when one speaker said there was too much emphasis on toys. Our toy began the Tuesday presentations, fortunately introduced by an insider, Dan Dwyer who had first encouraged us to try this after live tracking made its debut in the 2010 Tour de France. Rebecca Wiasak, recent Tour of Geelong winner, has been testing live data transmission during training and racing and came along for the show. Dan introduced Rebecca and her bike set-up and Rebecca rode off from the conference. I presented the technical details and then we connected Rebecca's and our Bali based collaborators live data and two way audio. Rebecca chatted with the audience and put in a short 900 watt effort in response to a request. It seemed to go alright and Rebecca's coach John Forrest thinks it has sufficient potential to present at a coaching conference in Adelaide this Tuesday.
Live data is now available from multiple smart phone based sports tracking applications. The applications are developing rapidly and are used by thousands of enthusiasts but they aren't currently used by the AIS or ACTAS. When I ask why, I'm told they are keen on live coaching but its only a novelty without power data. Our solution provides live SRM power data, which hopefully will help get live coaching happening at the AIS and ACTAS.
Google's live tracking at the 2010 Tour de France used the open source android app, My Tracks and we've stuck with that, providing a bridge application to control My Tracks and upload extracted data live to an existing web based sports training application. Unlike many of the conference participants I'm fond of toys but I'd be the first to agree there's a gulf between a new toy and changing how things are done. The challenge now is to bridge that gulf.
Review the presentation or follow these instructions to try it out.
Live data is now available from multiple smart phone based sports tracking applications. The applications are developing rapidly and are used by thousands of enthusiasts but they aren't currently used by the AIS or ACTAS. When I ask why, I'm told they are keen on live coaching but its only a novelty without power data. Our solution provides live SRM power data, which hopefully will help get live coaching happening at the AIS and ACTAS.
Google's live tracking at the 2010 Tour de France used the open source android app, My Tracks and we've stuck with that, providing a bridge application to control My Tracks and upload extracted data live to an existing web based sports training application. Unlike many of the conference participants I'm fond of toys but I'd be the first to agree there's a gulf between a new toy and changing how things are done. The challenge now is to bridge that gulf.
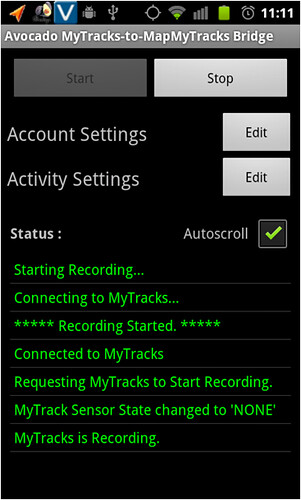 |
| Interface of the Avocado MyTracks-to-MapMyTracks Bridge. It controls My Tracks and uploads live training data to Map My Tracks. |
Avocado MyTracks-to-MapMyTracks Bridge Setup and Running Instructions
What
you need to run the application:
1.
Android
2.1 update 1 or above.
1. Avocado MyTracks-to-MapMyTracks Bridge is available for download. This version will upload SRM PC7 data except for power data. A version that also uploads power data can be provided by email on request.
2.
An
account on the website www.mapmytracks.com
3.
Latest
version of Google MyTracks obtainable from the Android Market.
Note: If you are interested in using an
SRM PC7 to track power data you will need an ANT+ capable handset. Also, at this time the version of Google MyTracks (1.1.10) available on
the Android Market isn’t able to connect to the SRM ANT+ Bridge. Use this My Tracks version instead.
How
to setup the application:
1.
Turn
on “Unknown sources”. You’ll find it in Android Settings >> Applications.
This will allow you to install applications from sources other than the market.
In this case, from the distributed APK.
1. If you are using Android 2.2 or above you can click on the install button while viewing the email with the Avocado MyTracks-to-MapMyTracks Bridge app attached from within the Gmail app. For Android 2.1 you need to log in to Gmail through the browser to download the app.
2. To install downloaded apps run the downloaded APK file either through the downloads in the browser or through a file explorer (it
should be downloaded to sdcard\downloads).
4.
When the first run, the bridge application will ask you for the username and
password. You should enter the MapMyTracks username and password. This will
allow the bridge application to upload data to your account in MapMyTracks.
Note: Authentication of the MapMyTracks
username and password won’t occur at this point, but rather it will occur when
you start an activity. Hence you won’t get to find out whether or not the
username and password are valid until when you attempt to start an activity.
This will be changed in a future version.
5.
The
bridge application will also ask you for activity details, these can be changed before every activity but experience suggests this is too much effort.
a.
The
title is the name you give to the activity
b.
You
can specify if the activity is public or private. Public allows everyone to see
the activity details. Private activities are only available to you.
c.
Select
the activity type from the list.
d.
Add
any tags you may wish. The tags group activities and make them easier to find.
E.g. you can place tags for the event you are using, the team you are playing
for, etc. Other people, can then find all the activities with the given tag,
including yours.
6.
Sharing
and access to third-party applications needs to be enabled in MyTracks. You’ll
find the setting in Settings >> Sharing >> Allow access. This would
allow the bridge application to control MyTracks (turn recording on and off)
and retrieve sensor information (e.g. heart-rate data) from MyTracks. Make sure
this setting is turned on before starting an activity.
When
you begin your activity:
1.
Make
sure you have your sensors configured in MyTracks (e.g. your heart-rate
monitor). You can go to “Sensor State” in MyTracks to check if the sensor
details are coming up or not, even before recording.
2.
Go
to the bridge application. It should be titled “Avocado MyTracks-to-MapMyTracks
Bridge” in your application menu.
3.
Press
the start button.
4.
Before
you start moving, wait until:
a.
You
get a GPS fix. This ensures that your whole activity is recorded.
b.
You
start seeing “Uploaded XX:XX:XX” with timestamps coming up on the “updates”
portion of the screen. This means the application has started uploading your
data. When this happens, others can see your updates live online. Currently,
there is a lag of about 5-15 seconds between the activity and the online updates.
At
the end of your activity:
1.
Go
to the bridge application and press the stop button.
2.
You
can view the offline details of the activity in MyTracks. Notice that the
GPS location samples in MyTracks are not the same samples used in the online version at present but we are planning to change this.
Monday, August 29, 2011
AvocadoAC - Activity Classifier
Today I'm presenting work on the AvocadoAC activity classifier application, for Android smart phones at the 5th Asia-Pacific Congress on Sports Technology .
Purpose of AvocadoAC
To continuously measure physical activity, classify activity by type and quantify activity intensity using the sensors of a smart phone. Once known sports training activities are detected the specialist application MyTracks is invoked to record and analyse activities in more detail.
This information can be used to:
The smart phone is an attractive platform for context-awareness because:
Battery life can not be significantly impacted.
Mobile phones are carried and used in a variety of ways.
Different model Android phones have different functionality. In particular some models disable the accelerometer when the screen is off.
Get the presentation .
Try the AvocadoAC activity classifier.
Purpose of AvocadoAC
To continuously measure physical activity, classify activity by type and quantify activity intensity using the sensors of a smart phone. Once known sports training activities are detected the specialist application MyTracks is invoked to record and analyse activities in more detail.
This information can be used to:
- Provide life-style information on total exercise, health and activity levels.
- Infer further lifestyle information by combining with other information sources, for example location data.
- Provide context to reduce data gathered and data management problems for sports tracking by only gathering high bandwidth data when it’s likely to be useful.
The smart phone is an attractive platform for context-awareness because:
- People carry mobile phones around in their day-to-day lives.
- Activity monitoring can run as a background application
- Smart phones are becoming ubiquitous.
Battery life can not be significantly impacted.
Mobile phones are carried and used in a variety of ways.
Different model Android phones have different functionality. In particular some models disable the accelerometer when the screen is off.
Get the presentation .
Try the AvocadoAC activity classifier.
Ken Taylor, U. A. Abdulla, R. J. N. Helmer, J. Lee, and I. Blanchonette. Activity classification with smart phones for sports activities. In APCST 2011: 5th Asia-Pacific Congress on Sports Technology, Procedia Engineering. RMIT University, Elsevier, August 2011. 162k View Download
Tuesday, August 9, 2011
Live Bicycle Tracking For The Masses
Tour De France Generates Interest
Live tracking was first available in the 2010 Tour De France and after I discovered it was done with a non public version of the open source Android application My Tracks and that the AIS cycling athletes wanted live tracking I've looked at the problem more closely. In summary they used a HTC Android handset with the firmware specially modified to use the ANT+ functionality already available on the phone's WIFI chip.
For the 2011 tour live data for a few riders was provided by the SRM Live application. Telemetry is provided by an SRM module as shown in figure 1.
The SBS tour tracker was the obvious Tour De France audience tool for 2011 with versions available for PC, Android and iOS. The tour tracker showed live video, commentary and data, including data from SRM Live, but got mixed reviews with criticisms focusing on the implementation. Another way to follow the action was to start with the twitter firehose using either #tdf or #tourdefrance then choose a few lower bandwidth tags, people or advertised sites to follow. My favourite site showed caricatures in profile with statistics and a commentary below. Mashups maximise the opportunity for creativity in presenting Tour De France data, providing information for expert commentary and, more broadly, presenting racing and training data in general. During this period of rapid innovation it is unlikely there will be one comprehensive solution.
Last Thursday, 4 August 2011, Dr David Martin presented an Australian Institute of Sport SMART TALK on "How the Institute helped former-AIS athlete Cadel Evans win the Tour de France". David mentioned he had the power data from the top three riders and that Cadel averaged 410 watts in the all important Stage 20 time trial. Live telemetry is experimental at the moment in big events and is available only for some riders but David expressed the view that, as for car racing where drivers are obliged to provide public telemetry, it is likely to be mandatory in future as live data can significantly improve the audience experience. David also mentioned that AIS athletes still don't have live tracking but they want it.
Live Cycle Tracking Applications
There are a wealth of sites tracking training data and some, like Endomondo and SportsTrackLive that provide live tracking. They are evolving fast and are gradually incorporating more sensors and sophistication, for example the Zephyr heart rate monitor. People are mixing and matching data from different sites and sources, most often by importing and exporting data in one of the XML formats KML, GPX or TCX. Site and application specialisation is occurring, particularly with integration into social media applications but existing training sites are mostly pitched at providing an end to end solution. Likely niche specialisations are:-
Remote Coaching
I found the web coverage of the Tour De France greatly enhanced the viewing experience. There still seems a lot of opportunity for greater sophistication in data presentation but improvements are coming thick and fast. Would adding a voice connection between the athlete and coach during training allow the coach to provide better advice remotely than than being there? Would it work for the athlete and would top coaches offer their services this way?
Update 9 Aug:
Thanks to David Martin for the advice that the 410 Watts mentioned for the stage 20 time trial is an estimate based on previously monitored fitness tests and time trials rather than data from the stage 20 time trial itself, which he hasn't reviewed.
Live tracking was first available in the 2010 Tour De France and after I discovered it was done with a non public version of the open source Android application My Tracks and that the AIS cycling athletes wanted live tracking I've looked at the problem more closely. In summary they used a HTC Android handset with the firmware specially modified to use the ANT+ functionality already available on the phone's WIFI chip.
For the 2011 tour live data for a few riders was provided by the SRM Live application. Telemetry is provided by an SRM module as shown in figure 1.
 |
| Figure 1 - The telemetry module is mounted behind the seat, has a GPS receiver and sends data via the mobile phone network |
Last Thursday, 4 August 2011, Dr David Martin presented an Australian Institute of Sport SMART TALK on "How the Institute helped former-AIS athlete Cadel Evans win the Tour de France". David mentioned he had the power data from the top three riders and that Cadel averaged 410 watts in the all important Stage 20 time trial. Live telemetry is experimental at the moment in big events and is available only for some riders but David expressed the view that, as for car racing where drivers are obliged to provide public telemetry, it is likely to be mandatory in future as live data can significantly improve the audience experience. David also mentioned that AIS athletes still don't have live tracking but they want it.
Live Cycle Tracking Applications
There are a wealth of sites tracking training data and some, like Endomondo and SportsTrackLive that provide live tracking. They are evolving fast and are gradually incorporating more sensors and sophistication, for example the Zephyr heart rate monitor. People are mixing and matching data from different sites and sources, most often by importing and exporting data in one of the XML formats KML, GPX or TCX. Site and application specialisation is occurring, particularly with integration into social media applications but existing training sites are mostly pitched at providing an end to end solution. Likely niche specialisations are:-
- sensors e.g. the Zephyr heart rate monitor or SRM power meters
- data capture applications e.g. My Tracks
- data repositories and data feeds e.g. Google fusion tables
- data presentation
- specialised analysis
- tailored advice from coaches and experts
Remote Coaching
I found the web coverage of the Tour De France greatly enhanced the viewing experience. There still seems a lot of opportunity for greater sophistication in data presentation but improvements are coming thick and fast. Would adding a voice connection between the athlete and coach during training allow the coach to provide better advice remotely than than being there? Would it work for the athlete and would top coaches offer their services this way?
Update 9 Aug:
Thanks to David Martin for the advice that the 410 Watts mentioned for the stage 20 time trial is an estimate based on previously monitored fitness tests and time trials rather than data from the stage 20 time trial itself, which he hasn't reviewed.
Sunday, July 24, 2011
Heart Rate Training Zones
A Zephyr heart rate sensor can be connected to the My Tracks Android smart phone training data application.
Once you get past the novelty of seeing a heart rate during exercise you'll want to use it for selecting a target rate or at least characterising your exercise effort. There are simpler methods, but using the more accurate Karvonen method, the target rate is determined by the maximum rate, resting rate and desired training zone. Training zones can vary in number and definition with five being a common number as shown in Table 1.
Table 1. - Training zone definitions from Fitness Training Zone and 3-Fitness & Wellness. The Fitness Training Zone website provides a good explanation of each of the zones.
Maximum rate can be determined by methods involving heart rate measurement at sub maximal exercise levels then adding a margin or a variety of related methods which ultimately aim to get heart rate to the maximum possible for a short period. The one tried here is the 2-4 Minute Test . The results are shown in figures 1 and 2.
To generate these graphs export data from My Tracks in TCX format then open in Microsoft Excel 2007. TCX is an XML format and XML tables can be directly imported into an Excel spreadsheet.
The resting heart rate averaged over 4 minutes for the 50 year male was 55 bpm and for the 16 year old female 81 bpm. Applying the Karvonen method leads to the heart rate zones in table 2.
Table 2. - Training zones for a male aged 50 and female aged 16.
At 159 bpm driving a Go Kart takes the 50 year old male into the aerobic running zone, at 126 bpm walking up a mountain takes the 50 year old into the light walking zone and riding a bike for transport to 136 bpm which is also in the light walking zone.
Once you get past the novelty of seeing a heart rate during exercise you'll want to use it for selecting a target rate or at least characterising your exercise effort. There are simpler methods, but using the more accurate Karvonen method, the target rate is determined by the maximum rate, resting rate and desired training zone. Training zones can vary in number and definition with five being a common number as shown in Table 1.
| Zone 1 | Zone 2 | Zone 3 | Zone 4 | Zone 5 | |
| Fitness Training Zone | 50-60% | 60-70% | 70-80% | 80-90% | 90-100% |
| Light | Easy | Aerobic | Anaerobic | VO2 Max | |
| Walking | Jogging | Running | Hard | All Out | |
| 3-Fitness & Wellness | 60-70% | 70-75% | 75-80% | 80-90% | 90 - 100% |
| Overdistance, strength | Endurance, strength | Endurance, strength | Intervals, hills, race/pace | Racing, speed |
Table 1. - Training zone definitions from Fitness Training Zone and 3-Fitness & Wellness. The Fitness Training Zone website provides a good explanation of each of the zones.
Maximum rate can be determined by methods involving heart rate measurement at sub maximal exercise levels then adding a margin or a variety of related methods which ultimately aim to get heart rate to the maximum possible for a short period. The one tried here is the 2-4 Minute Test . The results are shown in figures 1 and 2.
 |
| Figure 1 Determining maximum heart rate for a male age 50 |
 |
| Figure 2 Determining maximum heart rate for a female aged 16 |
To generate these graphs export data from My Tracks in TCX format then open in Microsoft Excel 2007. TCX is an XML format and XML tables can be directly imported into an Excel spreadsheet.
The resting heart rate averaged over 4 minutes for the 50 year male was 55 bpm and for the 16 year old female 81 bpm. Applying the Karvonen method leads to the heart rate zones in table 2.
| Zone 1 | Zone 2 | Zone 3 | Zone 4 | Zone 5 | |
| Male 50 | 124-138 | 139 - 152 | 152 -166 | 167 - 180 | 181 - 194 |
| Female 16 | 129 - 139 | 140 148 | 149 - 157 | 158 - 168 | 168 - 177 |
| Light | Easy | Aerobic | Anaerobic | VO2 Max | |
| Walking | Jogging | Running | Hard | All Out |
At 159 bpm driving a Go Kart takes the 50 year old male into the aerobic running zone, at 126 bpm walking up a mountain takes the 50 year old into the light walking zone and riding a bike for transport to 136 bpm which is also in the light walking zone.
Subscribe to:
Posts (Atom)