Bicycle race tracking has been growing. Data presentation is still in its infancy but it has already been exciting to watch power and heart rate live in major competitions. Watching the Giro d’Italia on Saturday night I looked for some tracking and there wasn't any. Now I know why, the UCI has banned it, advising National Federations in a note issued two days into the Giro. On the TV it was a real buzz to watch someone I'd met,Fumiyuku Beppu in the breakaway for much of the seventh stage. I wondered how the rest of Green Edge were faring but back in the peloton they were mostly invisible. The commentators said Green Edge had a rider in the breakaway in Stage 6 as well but it was a wasted effort because they dropped back just as the coverage started.
What The UCI Said
Julien Carron, UCI Technological Coordinator, said "the UCI thinks that the future of the sport of cycling goes through ...new technologies.. in particular with the localisation of riders during the race and on-board cameras". Is that cool or what, I've previously wondered "Why Isn't Race Tracking Ubiquitous?" and the note reveals that the UCI thinks it will be too.
The crux of
Julien's note though, was that "neither cameras nor GPS tracking systems are allowed in any competition" until an expert committee presents its conclusions despite that "Exceptions may have been granted in the past on several occasions". Actually I thought live race tracking was pretty common. SRM in particular, tracks lots of events. It's only transmitting data to external parties that is banned, not tracking per se which Julien clarifies by; "Naturally, this ban does not concern the personal use of GPS systems (from which the information is not transmitted to the media, sport directors, organizers, etc.) which remain tolerated until further notice." So tracking isn't banned, just live tracking.
I'm wondering what the context of the note is. Why are they banning race tracking now, its been happening since the 2009 Tour de France? Did it become an issue with tracking the Giro, has there been some other recent development? Why not let race tracking continue in an adhoc way until the expert committee has figured out how to do it better. It was also a surprise to learn the tracking system I deployed in the Tour Down Under was an exception. I'd assumed that being approved once it would be OK for future events. I wonder how you get to be on the expert committee, does tracking a race previously qualify you?
The Reaction So Far
I've searched the internet for answers to these weighty questions but come up blank. The disquiet over banning race radios continues, most recently expressed in twitter comments from two prominent sporting directors.
Well, end result was good, but the lack of radios makes racing so silly. Heck, don't give me a radio, just let the riders talk to each other
Race radios were discussed a while ago at The Inner Ring and Cycling News reports that Stephen Roche, one of several UCI backed representatives on the board of the Professional Cycling Council (CCP) is "trying to upgrade the image of cycling". Roche's main bugbears are team cars helping riders back onto their bikes after toilet breaks or mechanical problems; riders unzipping their jerseys; and the use of team radios. So no mention of race tracking there. The UCI has declared the approval protocol for frames and forks to be a successful process and are extending the label to cover other bike components, starting with wheels. Race tracking equipment is not mentioned but perhaps it will have to be labelled "UCI approved" in future also. I'm sceptical of the value of helmet cam video where there is already motorbike mounted cameras but that part of Julien's note has got some discussion previously, most notably when helmet cams were banned part way through last years Tour of California. However, I can't find anything on race tracking so into the vacuum I'll inject some thoughts.
Visualising Tracking Data
The potential for live tracking is huge. The vast majority of races are without helicopters and cameras on motorbikes. Tracking these races and overlaying the data onto simulated terrain or pre-existing imagery like street view can provide pretty good coverage at very low cost.
Experiments in techniques for visualising rides with tracking data acquired on a Green Edge training camp
The 2012Women's Tour of New Zealand provided almost no coverage beyond final results so as far as I'm aware the simulation below, built from race tracking data is the only race video of the event.
Highlights of the 2012 Womens Tour of New Zealand - Stage 3 built with tracking data from 4 riders.
Another approach is to overlay data onto existing video. Using video of Simon Gerran's 2012 Milan San Remo win from youtube and tracking data provided through SRM, graphics are overlayed onto the video by SUFFERvision.
Overlaying data onto video or producing video from tracking data will probably get the most traction in the short term. But data driven simulators can offer more. As an example, imagine the driving simulator below driven by tracking data.
Travelling from Australian National University, Canberra to Parliament House using an open source driving simulator. If you have a Google Earth browser plug-in installed give it a try.
With video you are limited to the perspective of the camera but with full simulations you can watch the race from any perspective and I could have kept an eye on the rest of Green Edge in the Giro stage 7.
Going further, you can take the live race data and project forward in time as well. That would allow you to drive simulations like the popular Pro Cycling Manager with real data and allow viewers to try their hand as a race director during the race. The possibilities are endless.
A simulation game where you play the role of the team director could be driven from live data.
How Race Tracking Could Be Improved?
I expect that a better common understanding would make race tactics more visible and the race more interesting to all. So allowing everyone to see more could be a good strategy.
Until now only a few riders in each race have been tracked. This has great novelty value but is not enough to understand a race. Each extra rider that is tracked increases the value of the information from the existing tracked riders by providing context. A rider speeding up or slowing down means little unless you know they are in a breakaway, crossing a gap or dropping back.
Location data is not controversial. Riders don't usually mind revealing where they are. Therefore the UCI should aim to provide live location data for all riders as soon as possible but if it's compulsory any rider that doesn't want to be tracked can probably find a way to make their tracker fail. Heart rate and power will add interest but it's controversial. Some riders have been happy to supply power and heart rate data, so make it voluntary and see what emerges. Interestingly riders don't necessarily have any say in who sees their power data. All the power meters and most heart rate monitors transmit their data using ANT+ technology which, unlike bluetooth, provides no security. I know of one developer who is building an application to collect heart rate and power data from all nearby riders and as long as the data is not transmitted live I expect Julien's note would allow it's use.
It is early days. Don't stifle innovation.
Separate data delivery and data presentation. I would expect rapid innovation in the presentation layer from multiple players if the data is easily accessible.
The technical issues surrounding collecting and distributing the data are not trivial. Race tracking data can be expected to get better over time.
Bicycle racing happens on several scales. Most of the time you want to know which group a rider is in and how far that group is off the pace. You want power and heart rate data summarised over significant periods, perhaps for a climb. There are moments, particularly around finishes, sprints and incidents where very detailed data is required to understand what went on. Transmitting high resolution data continuously is too bandwidth intensive so smarts are required on the bike to decide what needs to be transmitted. All the existing systems are a compromise and transmit the same data regardless of the situation. Mostly more than is useful but in some situations, not enough.
We've tried trackers in the jersey pocket, which was inconvenient to the rider and under the seat which is not the best place for a GPS signal but works OK. I suspect the future is to replace the head unit on the handlebars and provide feedback to riders through the tracker as well. They will then see not only data from the bike but data on race progress. Continuous feedback of time splits would be useful to riders.
At the moment a common strategy for riders not expecting to win is to break away early in the event. Time and again the winner has spent most of the race out of site and unnoticed in the peloton. Race tracking data could be fed into models that are providing live predictions of the race result. These predictions could be quite exciting for viewers and the predictions themselves will probably change the race as riders will change there behaviour based on the likely outcome. Riders are doing that now but it's more random than it could be. The motivation for banning race radios is to make racing more exciting through increasing rider ignorance. This is almost the opposite approach of making racing more exciting by reducing viewer ignorance. It is probably impossible to keep the audience informed and the riders ignorant.
All of the existing live tracking systems are crude compared to what can be done. I've presented some ideas on what I think will emerge but amongst those with whom I communicate there are differing opinions on what form race tracking will eventually take and what technology to build it with. It is too early for a consensus to have emerged.
Could The Tour Down Under Be First?
I am hoping the Tour Down Under in 2013 will be the first race to comprehensively track the field. The UCI expert committee should have completed their deliberations by then.
A method that could work is to issue riders at pre race sign on with under seat trackers, similar to those we used in 2012, and collect them at the end.
The tracker under Jay McCarthy's seat can be seen in the scene just after Jay's easy win in a 2012 king of the mountain section.
Riders that are willing, can can link the trackers to their power meters, speed sensors and heart rate monitors as well. The race data could then be made available through an official application, a data stream for third party presentation and hopefully overlaid on TV telecasts.
Avocado Activity Classifier has now been published in Google Play. It uses the handset accelerometers to classify activities by type and quantify aerobic intensity in MET. Data is uploaded live to Google Fusion Tables.
Activity logging can be used to:-
Provide information on total exercise, health and activity levels.
Automate exercise tracking.
Infer further lifestyle information by combining with other information sources, for example location data.
How Much Time Do I Spend In Each Activity?
Using the Activities_Summary Fusion Table we can discover what proportion of time is spent on each activity. First we aggregate by activity and sum the time, then visualise the data with a pie chart, get the embeddable code and paste it into a web page or blog to give Figure 1.
Figure 1 Activity distribution for all time, updated every time the page is viewed.
Figure 1 is a live SVG graph which changes as the underlying data changes. It is nicely interactive but will not display on most Android web browers so it can be also be turned into the static image of figure 2 which will not update.
Figure 2 Activity distribution up to 26 April 2012 as a static image.
To get useful data, phone activities need to be separated from user activities. A large portion of the day the phone is charging, mostly overnight when I'm asleep. On average several hours a day the handset is detected as uncarried, mostly when I'm at home. As I'm not carrying it, the handset provides no information on my activities during this time but they would be mostly sedentary. Figure 2 is influenced by me being sick for a week so over time it should deviate from Figure 1. A depressingly small amount of my average day is spent running but I do commute by bike. At the moment this is classified as walking so is included in my walking figure. This will change in the future. I try to walk every day and this is reflected in the data. The rest of the average day I'm stationary which includes standing and sitting but in my case is mostly sitting.
Activity Distribution For A Particular Period
The aggregated data can be filtered for a particular period as shown in figure 3.
Figure 3 Activity distribution 14th - 16th of April when I was healthy.
This period is included in Figure 2 but I managed more walking and running in these few days than the average. These are reasonable activity levels to aspire to.
Activity Distribution For The Last 'n' Days
Until now the query for the data to be plotted was built by selecting options in the fusion table interface and the embeddable html this generated was pasted into this page. This hasn't required any programming but by adding a little JavaScript we can make the data to be plotted user configurable. As an example, take the embeddable code generated in the fusion table interface for the particular period shown in figure 3 and change the date filter value from a constant to a variable. Then provide a text box to capture user input. The JavaScript updates the query variable with the user input and sends the query to recreate the graph. The result, an activity distribution for the previous user chosen, number of days, is shown in figure 4. The JavaScript can be seen and copied from the page source beginning at //Example begins here// and ending at
This is where a graph goes.
Figure 4 Distribution of activities from today for a user configurable number of days.
//Example ends here//
Using figure 4 I can check if I am currently achieving the average daily walking times to which I aspire, shown in figure 3 .
Average MET For Each Activity
Sitting on the couch watching the TV gives a MET of 1 in contrast to, say, jogging which can require 7 times more energy. Step counting with a pedometer is often used to quantify exercise levels as the sensors are cheap and everyone understands steps, but MET is a better standard for quantifying aerobic effort. Metabolic Equivalent of Task (MET), or simply metabolic equivalent, is a measure of the intensity of aerobic exercise.
Aggregating by activity, excluding running, averaging MET and viewing as a line graph gives the result in figure 5.
Figure 5 Average MET for each activity excluding running for all time. All "Uncarried" activities are handset rather than human activities and MET is recorded as 1 because there is no information to show the human is not sedentary.
MET can be measured from accelerometer data quite accurately in most situations but not all. For example, accelerometers will measure the increase in MET with increasing speed but are insensitive to change of grade. It's superior to step counting though, as step count is unaffected by both pace and grade. I like to walk up mountains and try to do so daily so some of my walking will be at a higher than measured MET. My running sample is too small for the MET to be meaningful.
When Does Walking Happen?
You can plot duration versus time for a particular activity. Most of my physical activity is walking so filtering on walking and visualising the result as a zoomable line chart shows when I do it as illustrated in figure 6. Try zooming these graphs or sliding the graph window with the control in the lower window. It is very nice.
Figure 6 Minutes walking versus time shows what time of the day long walks take place
Doing the same thing for MET gives the result in figure 7.
Figure 7 MET while walking versus time.
Comparing figure 6 and figure 7 shows that I get the majority of my aerobic exercise during the long walks. My MET during these walks is double the overall average shown in figure 5 even though it is underestimated when climbing mountains.
Fusion Tables
As demonstrated in the above examples Fusion tables provide a great opportunity to play with your activity data and fine control over what you publish or share with friends. The examples above have links to the graph definitions that can be copied for your own data. Avocado Activity Classifier creates two Fusion Tables; the Activities table which contains a lot of detail and the Activities_Summary which is a subset of the first and intended to be shared.
Battery Consumption
Avocado Activity Classifier runs intermittently in the background whenever the phone is on and will be too inconvenient to use if it consumes significant battery power. The accelerometer, a BMA150, in many handsets is a low power device. If it was configured to transfer data periodically using interupts, battery consumption while activity monitoring could be significantly reduced and somebody will probably sell an Android sports phone one day that does it. Currently AvocadoAC has a 20% duty cycle, sampling 6 seconds out of every 30. Consequently it already draws less from your battery than pedometer apps but we are still searching for the sweet spot. In the test shown in figure 8, power consumption is lower than Cell standby and Phone idle which hopefully is low enough to satisfy most users.
Figure 8 After over 10 hours the battery is still at 80%. Battery consumption in this test is lower than Cell Standby and Phone idle. WiFi was on but not connected and consumed double the power of AvocadoAC.
The effect on battery life for any particular user is highly dependant on use patterns. I usually get through a day OK and recharge every night. Battery consumption is low enough in this case so as not to be noticed. If you don't get through a day on a single charge the battery will fail slightly earlier but it's not likely to be noticed because other things, most likely the display, will be dominating consumption. If you normally go 3-4 days between charging then very little battery is being consumed and you are likely to notice the additional load from Avocado Activity Classifier.
Where Does This Work Fit?
Our overall goal with this work is to monitor exercise and training and make lifestyle, training and tactical race decisions based on data rather than guesswork. The data that could be recorded is almost infinite and the effort to acquire it can easily be greater than the value of the information that it provides. Therefore, data acquisition must require as little human intervention as possible. This requires; methods to detect what data is appropriate for any particular situation, acquiring the minimum necessary, summarising the data as it is recorded and storing the summary in a useful form.
Avocado Activity Classifier is intended to provide a record of exercise and activity data during the course of a day and when a training activity is detected invoke other applications suitable for monitoring specific training activities all without user intervention.
Ken Taylor, U. A. Abdulla, R. J. N. Helmer, J. Lee, and I. Blanchonette. Activity classification with smart phones for sports activities. In APCST 2011: 5th Asia-Pacific Congress on Sports Technology, Procedia Engineering. RMIT University, Elsevier, August 2011. 162kViewDownload
Previously I asked, "is live bicycle tracking going to have a major impact on cycling"? This was in a training context and in the few weeks since, under the guidance of Dave Martin from the AIS, we started investigating its usefulness at the AIS Womens Road Cycling Camp and the first GreenEDGE training camp where we tracked rides around Canberra and Thredbo. Most of the GreenEDGE team management and Australian members have have been part the AIS in some capacity due to the longevity of the AIS cycling program so they work well together. Matt White, an AIS graduate, introduced me to pro cycling and GreenEDGE Technical Advisor, Lars Teutenberg had enthusiasm for tracking and experience in some practical aspects that proved invaluable, having worked with the Google team on tracking the 2010 Tour de France. We were using a different version of the same My Tracks software. It would be rare to find a situation more serendipitous.
Despite growing use of sports tracking at sub elite levels using services like MapMyRide, Endomondo, SportsTrackLive, Runkeeper, etc. I observed little use of live tracking amongst elite cyclists, so whatever potential it offers remains to be exploited. Even simple information, like knowing where everyone was on a training ride, was useful for increasing training efficiency. This seemed odd, but Hunter Allen from Training Peaks speaking at Interbike 2011 makes the same observation for power meters, noting they were first popularised at sub elite levels. He calls the phenomenon trickle up, in contrast to motor racing where technology trickles down. Cadel Evans, another AIS graduate, has been emphasising the importance of simulation technology and is "'confident' his team remained at the cutting edge" in his 2012 Tour De France preparations but there is a wide variety of attitudes to technology and science in cycling. Laboratory based techniques, which the AIS use intensively, are well developed but there seems a lot left to exploit in measurement and analysis of training and race data.
While aiming to increase cycling performance and training effectiveness we got the opportunity recently to track a few races. Only the biggest races have comprehensive TV coverage and even then, with the cameras mostly watching the leading riders and little statistical information, much of the action is never observed. One GreenEDGE rider at the Thredbo training camp likened bicycle racing to a chess match and it became apparent while tracking these races there is tremendous potential to expose far more of that subtlety to a race audience. Tennis, cricket and motor racing viewing are greatly improved by sophisticated audience information systems as demonstrated in this F1 system from McLaren.
Tour Down Under
The most high profile event tracked was the 2012 Tour Down Under in Adelaide. MapMyTracks fast tracked their development of a new event interface for this event which considerably improved the viewing experience. Riders are represented by their race number. In earlier events riders carried the trackers but for this event we mounted the trackers in saddle bags. This is not the ideal position for viewing GPS satellites and is subject to high levels of vibration but the trackers can be fitted to the bikes several hours before the race which helps with logistics, do not interfere with airflow over the bike and do not interfere with or require any attention from from the riders. Other firsts for this event were:-
Tracking initiated by timer to align track for all riders and minimise drain on the battery prior to starting the event.
Remote monitoring of battery condition.
The ability to suspend tracking mid event to preserve batteries.
Remote control of starting, suspending and stopping tracking.
High resolution data can be remotely accessed post event using dropbox.
Tracker software and settings can be updated semi automatically which was needed for practical management of groups of trackers.
This was a lot of untested innovation. Minor tweaks and experience gained during the event in optimising its use meant tracking improved as the tour progressed. Dave Martin organised UCI approval of the tracking equipment which wasn't finally granted until the eve of the event. Paolo Menaspa took responsibility for liaising with teams and for fitting and recovering the trackers each day.
Down Under Classic
The event opened with the Down Under Classic criterium. The new interface shows all of the riders on an overhead view and takes a minute or two to download all of the data required to properly display the replay of a long race. It is most interesting when the control to speed up the replay is used to watch the race at 16 or so times faster than it was run.
About one third of the way into the race this view shows a breakaway group containing two UniSA
riders, Bernard Sulzberger 186 and Jay McCarthy 182. The leading GreenEDGE rider was Leigh Howard 7 and the last rider tracked was Steele Von Hoff, 181 who finished in 5th position overall and was the highest placed rider tracked.
The interface also provides statisitical information including heart rate and power where it is available.
In this race Luke Durbridge, 3 was involved in a pre race collision, so did not start and tracking was lost from Lachlan Norris, 184. Most of the GreenEDGE team streamed data from their SRM Power Control 7's but only Simon Gerrans was wearing a heart rate monitor. Not many of the UniSA team were using PCS7's but power and cadence data is also available for Jay McCarthy, 182.
There is also an interface for each individual rider and their monitored data.
Zoomed in on the the individual page for Simon Gerrans, 4 to show a lap and a half of cadence and power data near the end of the race.
In a Mozilla browser, but not Chrome the power graphs can be zoomed to particular regions. Zooming to the portion of the race from the start to the time the rider eased off as they approached the finish I extracted the average power which is listed in the table below.
Race Number
Position
Name
Team
+ Time
Average Power (W)
2
15
MCEWEN, R (AUS)
GreenEDGE
0:00:02
261
185
34
PALMER, T (AUS - ACT)
UNI SA - Australia
0:00:17
187
36
CLARKE, W
UNI SA - Australia
0:00:17
182
37
MCCARTHY, J (AUS - Qld)
UNI SA - Australia
0:00:17
295
183
57
DENNIS, R (AUS - SA)
UNI SA - Australia
0:00:17
5
59
GOSS, M (AUS)
GreenEDGE
0:00:17
279
4
80
GERRANS, S (AUS)
GreenEDGE
0:00:37
254
184
102
NORRIS, L (AUS - Vic)
UNI SA - Australia
0:00:37
186
109
SULZBERGER, B (AUS - Tas)
UNI SA - Australia
0:00:37
6
110
O'GRADY, S (AUS)
GreenEDGE
0:00:37
7
124
HOWARD, L (AUS)
GreenEDGE
0:01:05
278
1
DNF
DNF MEYER, C
GreenEDGE
DNF
I'd heard a theory that Robbie McEwen had a talent for preserving energy by riding on the wheel of others which allowed him to beat many stronger riders. This data supports that theory as Robbie was the first to finish of the tracked riders with almost the lowest energy expenditure. The extra effort Jay McCarthy expended in the breakaway is also visible as he had the highest energy expenditure, 7% more than Robbie, even though he finished 15 secs later. Leigh Howard worked hard but finished over a minute behind Robbie. This demonstrates the advantage of tracking more riders. Everything in a race happens in a context and the more riders that are tracked the more meaningful is the information revealed. Each additional rider tracked increases the information content in the data of the riders already tracked so race tracking will be more useful when it is universal.
This race was the first time we tried carrying trackers in saddle bags and the first packaging design failed as several handsets were separated from their protective bubble wrap by the end of the event. Double layer bubble wrap pouches were manufactured for subsequent events. Tracking quality was good for this event as we tracked two full teams. Criteriums are the easiest races to track because:-
The logistics are fairly easy, starting and finishing in the same place and providing reasonable access to bikes and riders.
They are short, eliminating battery management issues.
They are generally conducted in locations with good mobile infrastructure.
Compared to road races tracking criteriums has the least to offer a local audience because:-
Most of the course is visible to an observer.
They are short, with little time to consider statistics.
They are high action, low strategy events.
However tracking provides race coverage for remote viewers and could offer video like aerial imagery as shown in this example tracking some of the riders at a Canberra Criterium.
With a bit of effort video could be generated and delivered live via YouTube Live streaming. Alternatively the data can be streamed live into Google Earth which requires low bandwidth and allows viewers great control over how the race is viewed, choosing viewpoints, which rider they follow etc. This can be tried with the data used to make the Canberra Criterium video.
Prospect to Clare Stage 1
In Prospect to Clare Stage 1 the GreenEDGE trackers travelled by car so part way into the race the GreenEDGE trackers were remotely switched off. The race was tracked from the start and Dennis Rohan, 183 was tracked well in an early breakaway. Battery life was monitored remotely and UniSA trackers were periodically switched off to extend their life. While the UniSA trackers were off some of the GreenEDGE trackers were restarted to provide vehicle location. No trackers lasted to the end of the race and the swapping between trackers made race data confusing but vehicle location was useful information so the idea of tracking vehicles was continued in later races. Battery quality varied between trackers with periodic remote monitoring of battery condition revealing the trackers that were performing worst. The batteries in these trackers were replaced in post race handset servicing.
Colemans Group Stage 2 In Colemans Group Stage 2 stage we were fortunate to be tracking Will Clarke's heroic win. Hopefully Will's effort will help overcome the fear some riders express that carrying trackers will reduce their race speed.
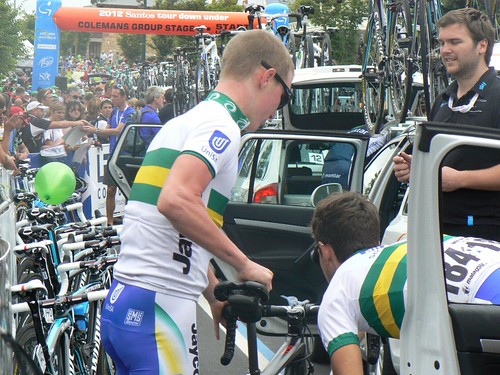
Will Clarke preparing for the race start. The tracker can be clearly seen under the saddle.
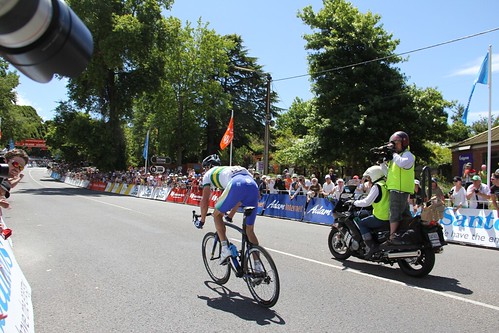
Will Clarke approaches the finish line alone 1 min 2 secs ahead of the peloton. The tracker is just viewable under the saddle.
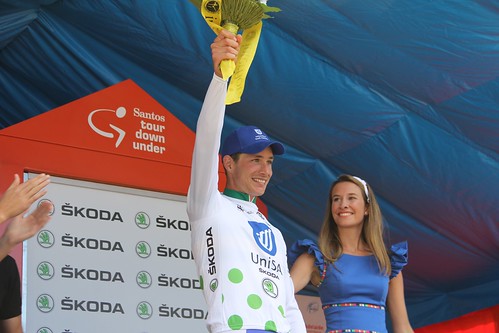
Will Clarke on the podium celebrating his King of the Mountain and Stage 2 win at Stirling.
Will was tracked from part way through the race for about 2 hours until his tracker battery expired 20 minutes before the finish. The online display has errors in the replay but the ride displays without errors by downloading the GPX file and viewing it in Google Earth. Suspension of other trackers was cycled to preserve battery life but juggling varying battery lives, trying to focus tracking on breakaways and interesting parts of the race while aiming to finish the race without unused battery life was challenging. Part of the course lacked mobile coverage so in addition to controlled suspension of tracking, viewers saw bicycles remaining stationary for a period followed by fast travel as buffered data is uploaded when the tracker re-establishes communication. Viewers reported that suspensions, pauses and rapid travel was confusing so a method of communicating data age to viewers is required. Will Clarke dominated the race highlights which provided many views of the tracker on the bike.
The tracker on Will Clarke's bike is first seen at 50 secs with quite a long view at 1 min 56 secs. There are further views at 2 mins 34 secs, 2 mins 42 secs, the end of the Jayco sprint at 2 min 55 secs , a glimpse at 4 min 2 secs and finally at 4 mins 22 secs after crossing the finish line.
Stage 3 To Victor Harbour
The longer battery life of the two Xperia Active handsets we possessed made for better tracking than with the Xperia X10 mini pros so we had ordered more. They hadn't arrived in time but FedEX tracking showed they would be delivered in Canberra on Tuesday. Umran flew back to Canberra Monday night and commenced preparing the new handsets as soon as they were delivered. Dave Martin picked them up Tuesday evening and drove the 14 hours to Adelaide on Wednesday while Umran tweaked the software. I got the handsets from a ragged Dave in Adelaide at 9 pm, uploaded the software tweaks and completed the preparation, packaging and charging by 2.30 am so that trackers could be delivered to the bike compound by 8.15 am for tracking of Stage 3 to Victor Harbour. Intermittent tracking had been confusing to viewers and we now had a full field of the longer life Xperia Active handsets so we started tracking half an hour after the race start so as to be confident of maintaining tracking, once started, until race end without suspension. This was a good strategy, so for the following races we estimated battery life then started tracking that period prior to the end of the race. The race replay starts from the scheduled race start so it should be advanced manually until tracking is commenced to see the action, which is confusing.
I travelled to Victor Harbour to catch the finish, which combined with some catch up work meant I didn't get to monitor most of that stage. The race replay looks good but the live experience was less satisfactory showing only a few riders in the race view due to an unforeseen combination of circumstances that was corrected for subsequent events. Also much of the race was through areas without mobile coverage which meant loss of live updates for part of the race.
Stage 4
In BUPA stage 4, 7000 people also rode the same course as the Tour starting at any of 4 locations several hours prior to the pro riders. This is a great feature of the Tour Down Under leading to one reporter writing "Heaven on wheels: is this Australia's perfect tourist event?" The CSIRO CEO, Megan Clark was riding so we tracked her as well and included her ride in the event.
Tracking CSIRO CEO, Megan Clark in the BUPA challenge with colleague Ian Blanchonette . The shadows show the early morning start.
Demonstrating the technology.
A nice enhancement next year would be to promote tracking for public riders who own either Android or IPhone smart phones from a downloadable app that records their effort and allows them to compare their ride to others and the pros in the sprint and hill climb sections.
Live tracking of bikes was smooth and reliable and remained that way for the rest of the Tour. Vehicle tracking of the GreenEDGE vehicle was lost as the tracker was carried within the vehicle in a location where it could not get a good fix on the GPS satellites. Tracking of the GreenEDGE support vehicle remained intermittent in the following races for the same reason.
Jay McCarthy had an interesting ride in a breakaway of four. He led them over Smith's Hill to win the first of two King of the Mountain sections.
Smith's Hill from bottom to top highlighted in red. The profile shows any two of a variety of parameters, in this case power and elevation, using KML data downloaded from MapMyTracks.
Plotting only the power trace for Smith's Hill shows the effort expended to win the climb. Jay is leading a small breakaway, he eases off in preparation for the sprint finish then goes for it.
The zero power point corresponds to a small dip in the road and Jay eases off a little before the final surge.
Jay's easy win can be seen at 1 minute 35 seconds in the race summary video followed by what seems a similarly easy win for Ruben Perez and a second for Blel Kadri over Jay at the following sprint finish. Jay leads the group into the sprint in both cases and the speed over the line is similar, 35 km/h for the hill climb and 43km/h for the sprint. Jay follows the same pattern in both finishes but sprints harder and longer in the losing sprint. Overlaying the power trace for the first finish on the on the second allows a comparison.
Jay is just beginning his 15 second sprint at the start of the video scene. A second later he is passed at speed. At 100 metres to go Jay is closing the gap but it's too late. Jay had eased off more before the second sprint than the first and it looks like that's when Perez and Kadri commenced their effort. We don't have power data for Perez and Kadri but the speed differential as they passed Jay suggests they were applying the power while Jay was easing off.
I monitored part of the race from a coffee shop along the route and had a surreal experience where a BUPA Challenge rider drinking coffee on a neighbouring table was proudly telling his colleagues of a project his company was working on that was going to revolutionise cycling by tracking riders. They didn't yet have a deployable solution but they were building an end to end system from scratch, with industrial mobile phones. Most of the functionality he described existed in the configuration streaming data as he spoke. We use a slightly modified version of Google's open source MyTracks app, consumer hardware, the MapMyTracks API, the Tasker app for remote controlling our Avocado MyTracks Bridge app and Google Earth for investigating new ways of viewing the data. The BUPA rider's company will be competing against all of the existing sports tracking app providers, specialist organisations like SRM with existing solutions and large organisations like Garmin who are building systems that allow Garmin components to be mixed and matched in other systems. Many people I have talked to about health and sports tracking applications similarly aim to dominate the field but I believe the immediate opportunities require cooperation, open systems that interact and narrow specialisation. An emerging trend is a three layer model with a data capture layer, an on-line data store and a data presentation layer with components in different layers from different providers.
Jayco Stage 5
Stage 5 is the most watched in the Tour as it is broadcast live in Australia and around the world. The crowds were estimated to be 120,000 on Willunga hill and with many roads closed moving around the course was impractical. The mobile phone network was barely usable. Calls out were intermittent, outgoing SMS mostly failed to send and I couldn't call other mobiles at the race all day. At all of the races I have attended, on site monitoring of tracking was poor as the crowd always overloads the telco network during a race and it lacks sufficient bandwidth. This makes it difficult to use tracking information in a race environment. Tracking itself however, requires only low bandwidth and I didn't notice tracking delays, despite the heavily overloaded network.
I was privileged to spend the day at the UniSA pavilion where Patrick Jonker was providing the race commentary. There was a wired internet connection, until it failed half way through the day, after which further monitoring became impossible using wireless. Tracking information was used to support the commentary and for a short period the live tracking page replaced the broadcast television displayed on screens throughout the pavilion . I formed the view more work is needed to improve the supply of timely statistics from which a commentator can pick and choose and there have been a range of suggestions provided.
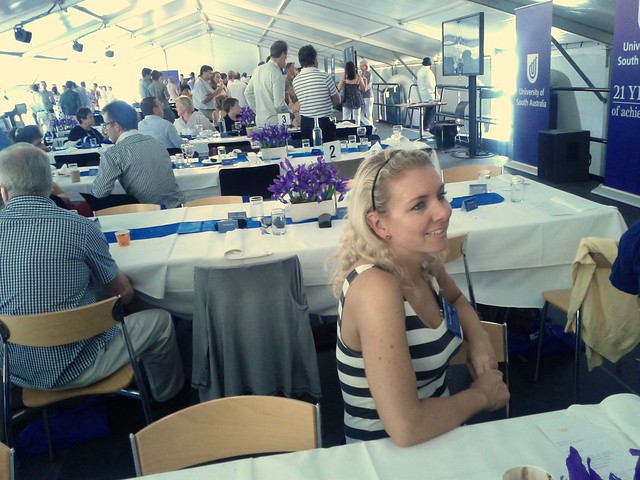
UniSA Pavillion at the Tour Down Under. Police waved from their cars as they went past which seemed odd until someone said
the SA chief of police was attending.
With Patrick Jonker who provided the commentary at this event and on ABC radio on other days.
We introduced tracking of the UniSA team vehicle in stage 5.
Stage 6
Stage 6 was a short course that would decide the overall winner. A handset screen was broken during the race but it didn't interrupt tracking which ran smoothly.
The screen on Will Clarke's Xperia Active tracker was cracked in the Tour Down Under Stage 6
The packaging had been sufficient to cushion the trackers through six previous days of hard racing but this failure demonstrated the harsh environment of an unsprung bicycle frame and that more thought is needed on packaging.
Tracker packaging used in the Tour Down Under 2012. The tracker was in a double layer bubble wrap pouch inside the saddlebag.
Luke Durbridge, who we had been tracking all week, played a dominant role in the race but in the confusion at the race start we'd failed to get a tracker on his bike. Andre Greipel won the sprint and led the peloton to win stage 6 in addition to wins in the Down Under Classic (no points) Stage 1, Stage 3 and several stage sprints. He was probably the most flamboyant rider in the Tour but finishing nearly 8 minutes behind Oscar Freire in Stage 4 put him out of contention for the overall win. The GC was between Simon Gerrans and Alejandro Valverde who were on equal time coming into Stage 6. Valverde finished 25th and Gerrans 27th in the leading group and they were separated by Robbie McEwen. This was probably the most interesting part of the race but being submerged in the peloton, the battle was mostly invisible to the race audience. Tracking could have revealed more of this drama.
Australia Road National Championships
Dave Martin, working with Lars Teutenberg, managed the tracking for the National championships. Dave was new to Android and the tracking app which combined with the pre race confusion made app configuration difficult. This provided further incentive to introduce remote control of the
tracking app in future races.
Trackers were carried in jersey back pockets. In this location they have a good view of satellites but compete for space with food and supplies. Amanda Spratt mentioned that the tracker interfered with her elaborate packing strategy and Luke Durbridge said we were lucky not to get the tracker back with a bite out of it as he kept mistaking it for a power bar. The tracker can be seen as a bulge in Luke Durbridge's back pocket in this SBS news report.
The tracker can be seen as a bulge in Luke Durbridge's back pocket in this SBS news report at 1minute 14 secs. This is late in the race so that Luke has already consumed the rest of his pocket contents.
In the Elite Men's Road Race we tracked Luke Durbridge with a long life tracker. The tracker lasted 4 hours 14 minutes before the battery expired and the race lasted 4 hours 7 minutes but we missed the end of the race as the last chance to manually start the tracker was 20 minutes before race start. Luke was in the thick of the action for much of the race. We also tracked Mitch Docker who wore a heart rate sensor and Michael Hepburn for a short period until his tracker failed.
Mitch Dockers heart rate is around 170 - 180 bpm during the climb and drops back on the descent to a bit over 100 bpm.
Lap 10, when Cameron Meyer opened up a gap, was a slow lap for the peloton with Luke Durbridge being 1 minute 34 secs slower than his race average to that point. I noticed it in the tracking but I didn't hear it mentioned in the race commentary. Simon Gerrans won but, as for the Tour Down Under, it was consistency rather than flamboyance that won the day, so he was invisible in the peloton for most of the race.
Spectators on course weren't aware of the split for most of the event.
Bay Criteriums
TheBay Criteriums was my introduction to tracking bicycle racing. Every event was tracked with assistance from Ian Blanchonette and Sue Horne in the first few days and Lars Teutenberg managed the final day on his own. We also tracked cycling commentator Phil Ligget's respectable effort in Amy's ride.
Follow links from the hubs to view individual rides.
The surprise to me was the complexity of the logistics and criteriums are the simplest races from a logistics perspective. Every start is somewhere new and therefore different. Riders look after clothing and food but not the bikes. Mechanics prepare the bikes before every event and place them in a convenient location for the riders. This is the last time when all the bikes are accessible in the one place but it can sometimes be a long time before race start. Riders individually prepare themselves mentally and physically for the race and appear as late as practically possible to pick up their bike and get to the start. SRM head units form part of the personal gear for some riders but are part of the bike for others. Those head units that remain with the rider are not available for configuration until the rider appears at which time it is inconvenient for the rider. Ideally a head unit would be configured with an ANT + address, perhaps the riders team number, at the start of a season and never be changed so that a tracker can be configured and fitted to the bike or handed to the rider as they collect their bike. In later events, some riders e.g. Amanda Spratt carried trackers without ever having seen them before which emphasises the requirement for an absolute minimum of rider involvement. In the Bay Criteriums the
tracking app was started manually on the device so many of the races show long periods of tracking before race start. As the riders carried the tracker in their jersey pocket it was necessary to spend a couple of minutes with each rider as close as possible to race start which is inconvenient. This provided motivation for the introduction of timed tracking starts and remote control of the
tracking app for later events. Once implemented, remote control allowed most tracker management to be done in a timely manner without disturbing the rider and reduced servicing between races. Ideally a handset should be entirely managed remotely which could could be done best with Android Cloud to Device Messaging, but this is not available in Android 2.1, the operating system on the Xperia X10 mini pro handsets used in this event. It is available, however, for the Xperia Active which we sometimes used in later events.
What's Next?
I'm not sure. We learned a lot about how to track races and got better at it as we progressed but there is undoubtedly many improvements to come in data presentation and analysis. There is a tremendous opportunity, using tracking, to improve current race coverage and post race analysis, particularly if all riders in a race can be tracked. It is so obviously useful I'm confident race tracking will grow and perhaps the appropriate question is why isn't it ubiquitous already? Garmin has an obvious interest in sports tracking but it's rumoured that the commercial side of Garmin's cycling team have been overruled by the sporting side which prefers to minimise availability of rider data. So that might be part of the answer.