MathJax

Tuesday, August 7, 2012

Climbing Gunung Batur While Avoiding Trouble

I'm fond of ascending peaks. In 1980 my first peak outside Australia and first live volcano was Gunung (meaning mountain) Batur, Kintamani, Bali. Unlike nearby Gunung Agung, which is tough, it is a modest peak with a five kilometre ascent that takes two to three hours. That makes it great for a  group  looking for some adventure bonding in which everyone can participate. Strenuous enough to be memorable but not too difficult. This easy access is not ideal for the guiding profession so, on Batur, they counter with a hard sell. Locals don't use guides and while foreign visitors often like to be guided, many would prefer to climb on their own. Guideless climbers still need directions, particularly as Batur is usually climbed at night with the aim of being on the summit for the sunrise.

The Route

There are multiple routes up the cone. The most used originates from a car park and from there proceeds up through the village, ascending the mountain by one route and descending by another. 3.00am to 4.00am is a good starting time to view the dawn from the summit.

Animation of the most common route up Batur and some attractions along the way.
The guiding office is near the car park and anyone starting from here without a guide will be accosted by the guiding enforcers. Climbers starting from elsewhere may be able to avoid this confrontation.

If you are climbing at night without a guide you will need a route map as you will cross many paths leading elsewhere and sometimes the correct path is the least obvious.

View Climbing Gunung Batur in a larger map with icon legends and route notes. The second icon is the carpark at the start of the climb and the first is at hotel Volcano III where we commenced.
I recorded the route with My Tracks and it is available as a GPX file for import into your mapping app. Most people walk around the rim but some of our party didn't want to go further after reaching the summit.

Alternatively, you could follow the torch light of another guided group but that may lead to trouble and is poor form if you have refused guiding services.

Then and Now

Despite being a modest climb, my first ascent in 1980 seemed quite an adventure. I had no idea Batur was there until I arrived on a trail bike after traversing roads impassable to cars.

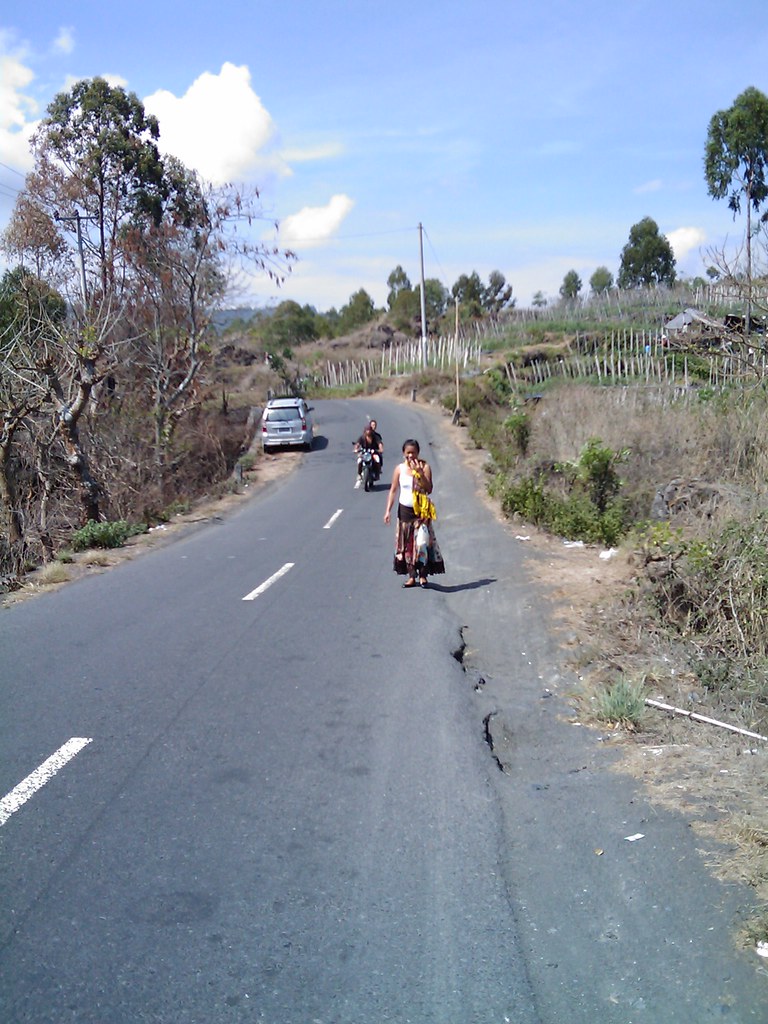
The road close to Toya Bungkah in 1980 with the village in the background.
Image:  Around Gunung Batur - in the past  set.

Heading towards Toya Bungkah probably close to  Kedisan, the village at the bottom of the descent into the caldera in 1983.
Image: Batur - Change From 1967 Until Now gallery.
The road near Toya Bungkah in 2009, still nothing special,  but much improved.  Nearby roads are built to a much lower standard and are still frequently impassable.
Image: Batur and Trunyan in 2009  set. 

The village was recent. In 1967 it had not existed and in 1980 a warung was the sole commercial establishment.
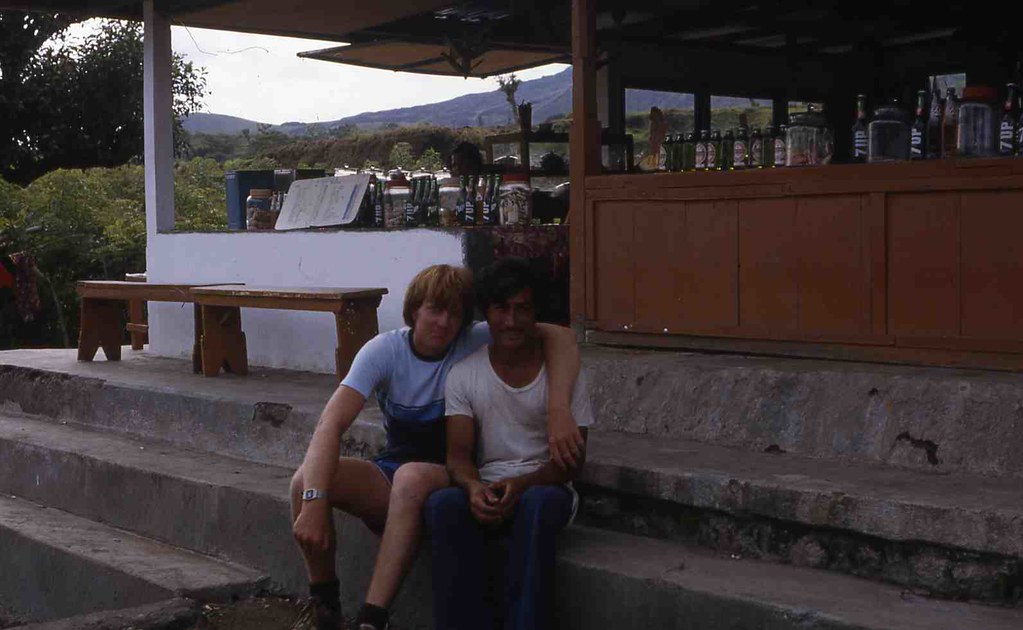
This warung, typical of the style in Bali at that time, was the only commercial establishment in Toya Bungkah in 1980. I slept in this guys home.
Image:  Around Gunung Batur - in the past  set.

It was an obviously poor village with the children spending their days tending to cows that aren't kept there any more.
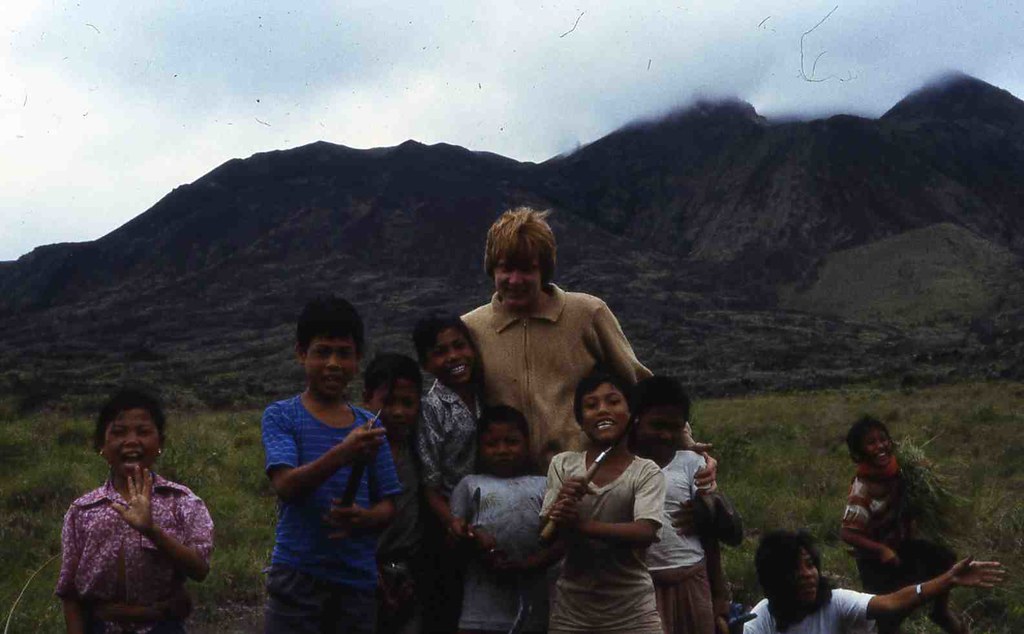
These kids spent their days cutting grass for the cows and didn't attend school. I don't know if all the kids go to school today but there are plenty of people here in their twenties who didn't and weren't taught to read.
Image:  Around Gunung Batur - in the past  set.
Today Toya Bungkah looks reasonably affluent but the surrounding area remains poorer than you will see elsewhere in Bali.

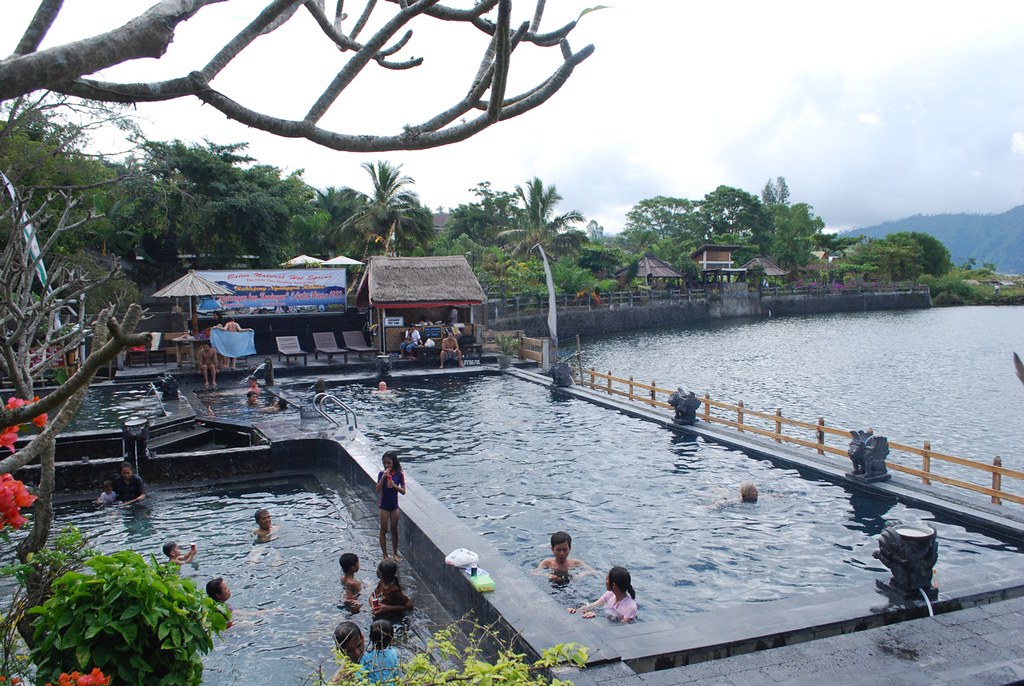
Apart from the climb, the principal attraction of Toya Bungkah is the hot springs which the locals use as a communal bath. The public facility was pretty good in 1983 but has been developed and privatised so that there are now several facilities exclusively for tourists, some quite expensive. There is one new facility next to the car park that is free for Toya Bungkah residents and Rp50K for all visitors including Balinese.

The hot springs were a well constructed public facility in 1983.
Image: Batur - Change From 1967 Until Now gallery.

The privatised facility on the site of the previous public facility, US$16 for foreigners and Rp40K for Indonesians. Toya Bungkah residents don't go here.
Image: Batur - Change From 1967 Until Now gallery.
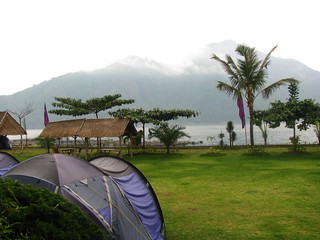
The Ayu hot springs facility, with accommodation and Bali's only camping ground. Upmarket and exclusively for tourists and the wealthy.
Image: Batur - Change From 1967 Until Now gallery.

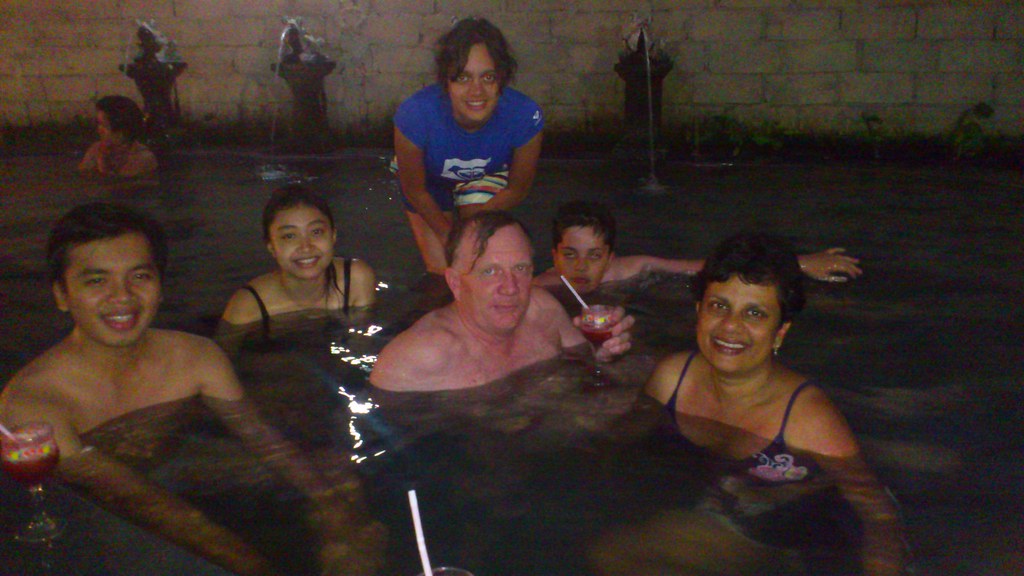
With the climbing team at the facility near the car park. Free for Toya Bungkah residents and Rp50K for everyone else with a welcome drink.
Image: Climbing Gunung Batur  set.
In 1980, I climbed from around 3.00am to view the sunset from the summit which I've repeated several times since, on most occasions without a camera.
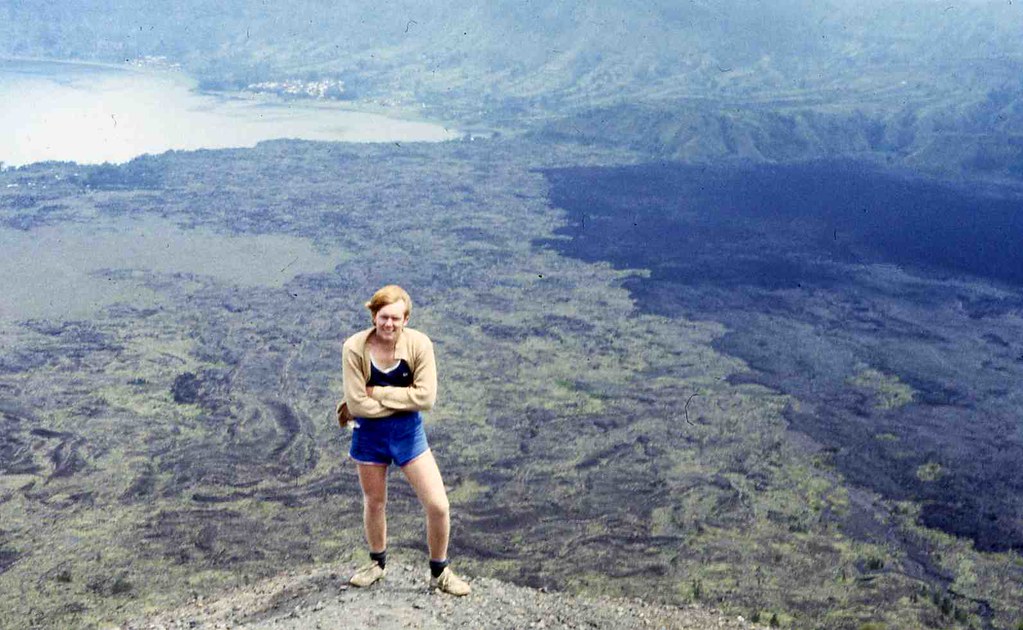
Ascending Batur in 1980
Image:  Around Gunung Batur - in the past  set.
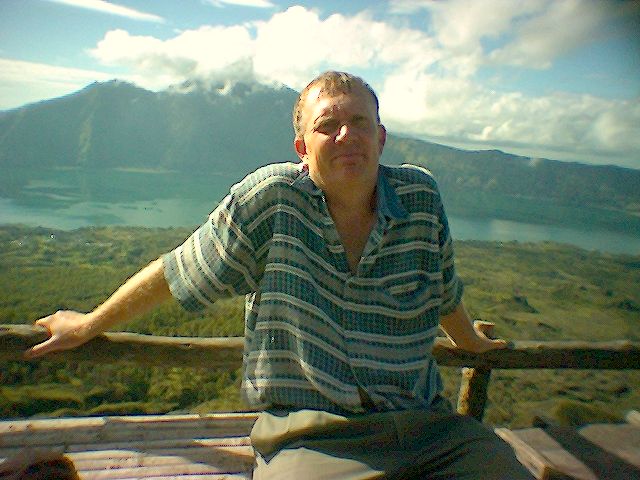
Batur in 2005
Image: Gunung Batur Climb  set.
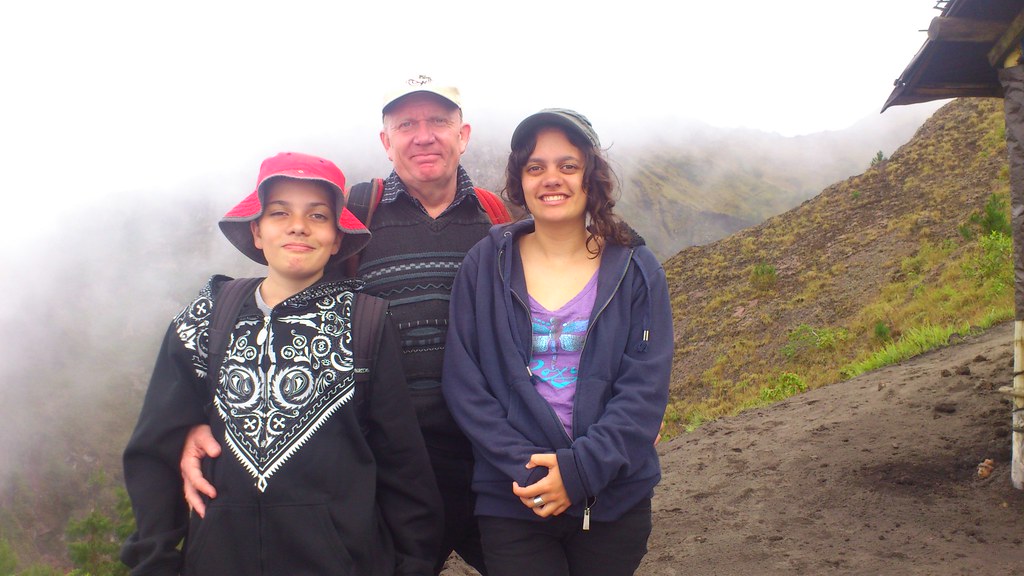
Near the summit in 2012 with children not much younger than I  was on that first climb.
Image: Climbing Gunung Batur  set.
There was no warung at the summit in 1980 but there was in 2004.
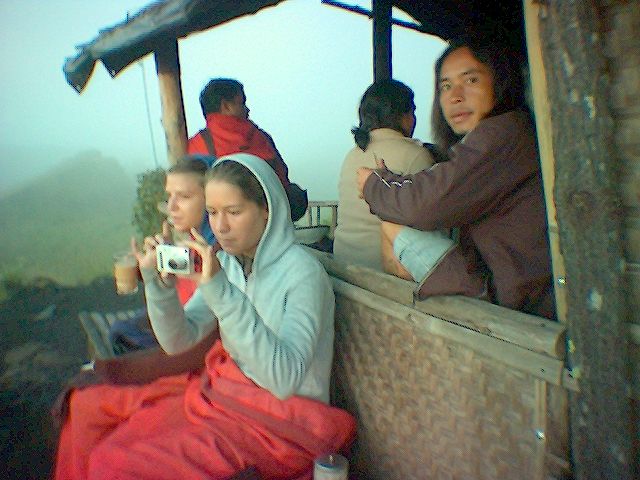
Climbers resting at the summit warung in 2004.
Image: Gunung Batur Climb  set.
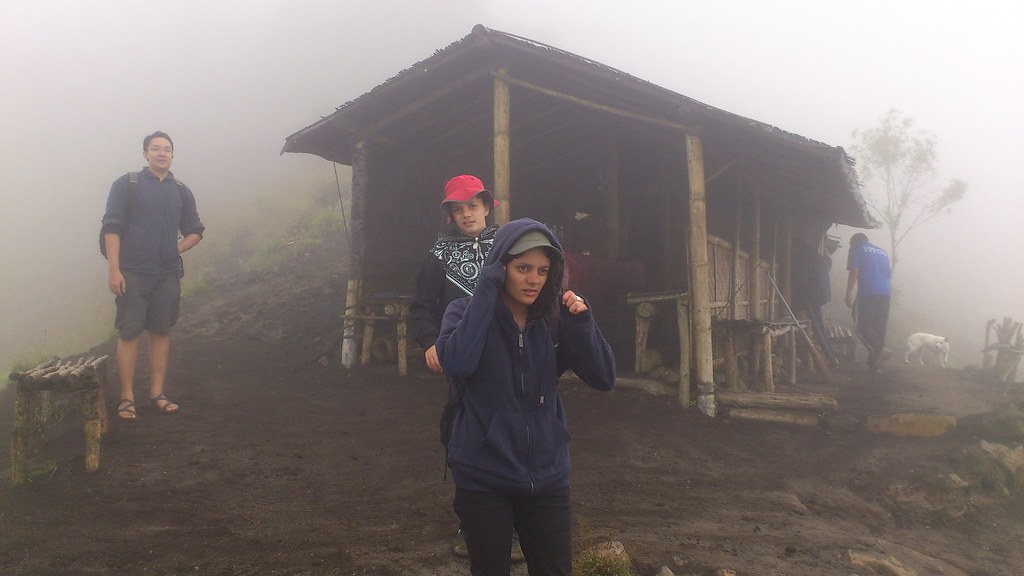
Our party at the summit warung in 2012.
Image: Climbing Gunung Batur  set.

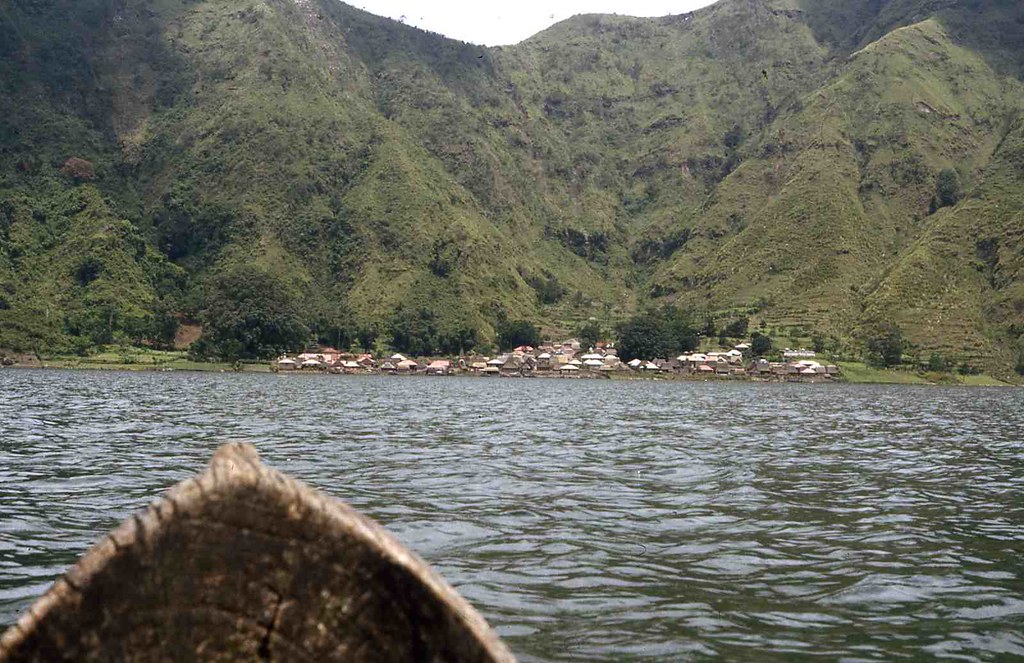
Across the lake is Trunyan.
It is a long way to the shore and I found this hollowed out log unstable and scary. Operating the camera while expecting to be in the water at any moment was tricky. You can drive on a rough track to Trunyan now but still need a boat to get the last few hundred metres to the cemetery.
Image:  Around Gunung Batur - in the past  set.
In 1980 it's bizarre cemetery had seemed exotic, though a bit unsavoury. Most climbers don't go there but lots of tour groups do from the wharf in Kedisan. I went back recently, to see what's changed and it's not a lot. Even in 1980, charging visitors to ogle grandmas remains was an income source for Trunyan.

Sky burial at Trunyan cemetery in 1980
Image:  Around Gunung Batur - in the past  set.

It hadn't changed much in 2009
Image: Batur and Trunyan in 2009  set.


Avoiding Trouble

It's easiest to pay up. Most climbers are brought directly from Ubud with the 40km drive being traversed in well under an hour when travelled in the early hours of the morning. A guide will be included in the package. You climb, swim and return with only pleasant experiences but are a little divorced from the locals. If you sleep nearby, particularly if you stay a few days, you will get a more grounded experience. This can be confronting as there is poverty and hassling, but you will see a different side of Bali with many people I've spoken to around the caldera claiming never to have been as far as Denpasar.

For the climb you will be strongly encouraged to hire a guide. It may seem compulsory but it isn't and lots don't. We checked in at the police station in Penelokan before descending into the caldera and checked back out on departure which my local colleague said was the norm though I'd never done this previously or heard of anyone anyone else doing it either.  Keen for reassurance from the police, we were also advised we couldn't be forced to hire a guide even when climbing with bule.

The Problem Is Widely Known

Batur rates as Number 4 on a  list of the Top 5 worst tourist rip - offs around Asia which states "Mount Organized-tourist-extortion is a good name for it." The  Jakarta Post reports "Anecdotal evidence says episodes such as these have been occurring around Kintamani and Lake Batur for some time, shaking the foundations of an important economic stream – tourism – for the region." and Trip Advisor documents some confrontations.

It's Been That Way For A Long Time

While I found Toya Bungkah pleasant in 1980 the guy that took me across to Trunyan kept telling me he feared extortion at Trunyan. This is is consistent with a quote from pg 19 of Custodians of the Sacred Mountain; Thomas A. Reuter; University of Hawai‘i Press; 2002; Travelers’ testimonies warn that local men may extort money from passengers by rocking their shaky boats as they ferry them across the lake. Authors of tourist guide books, who generally propagate romantic visions of smiling Balinese, have propagated the image problem of the hill people by characterizing them as “hostile, scruffy hustlers” (Winterton 1989:157–158) and as a potential “hassle” to those wishing to enjoy the natural beauty of their mountain home (Darling 1990:156).

"Ever tried walking up Mt. Batur alone? Try it and you'll get extorted by machete-wielding locals that demand you pay them $50 to be a guide." reports one climber from July 2004 showing it's not a recent phenomenon.

It's Economically Based

No one likes extortion (essentially taxation by non government entities), but it's most common in exploitative social systems when governance is weak. Modern China is sometimes described as a kleptocracy and under Suharto this was an apt description of Indonesia which weakens government authority. While Indonesia has been rapidly changing, these are strong traditions extending back to Dutch rule and they are more obvious in Batur than some other places. Apart from natural beauty, the area has limited resources and a long history of exploitation as discussed in Custodians of the Sacred Mountain; Thomas A. Reuter; University of Hawai‘i Press; 2002. This leads to distrust of authority and widespread opposition to taking advantage of opportunities like geothermal energy which will impact many but from which only a few elite are likely to benefit. The best assets are privatised by the politically influential and the poor barely get by labouring at agriculture. The only ways to escape hardship are to leave or exploit and with the best assets already taken, only services remain.

Many tourists will pay sums for half a days guiding that would otherwise require several weeks of agricultural toil to earn. Others stay away. In the absence of strong governance, groups emerge to capture the opportunity and without official authority, ultimately resort to stand over tactics to get their way. This is the environment that has bred the guiding cartel whose members can expect to do well as long as the monopoly can be maintained. One guide told me they have 63 members and work is divided amongst the members with each guide going to the bottom of  the list after each job. My informant said they averaged 20 climbers a day. While pricing is variable, they have strong pricing discipline, in my case, only dropping the guiding offer to Rp280,000 after things had become so unpleasant that hiring a guide at any price was unlikely. This can only be possible when they are effective in suppressing competition.

Batur's climbers are a mere quarter of 1 percent of Bali's visitors of 2.8 million in 2011. Guides from elsewhere will usually bring tourists only as far as Kintamani for the view from the caldera rim and will not offer the climbing opportunity. The road into the caldera is tough on their vehicles, so much so that I've known drivers to refuse the descent, and they are not keen to share guiding revenue with their colleagues in Toya Bungkah. While much effort goes into maximising revenue from those that turn up, there is little obvious effort on promoting the climb. Climbing is not everyone's thing but there is surely an opportunity to increase Batur's current visitor numbers. One tourist in a hundred ought to be easy. Working against that is the community inequality, coercion and distrust of government that makes it difficult to achieve more cooperation and investment in shared infrastructure, particularly roads, that would be required to attract large visitor numbers. The guiding association's ambition of Batur being an upmarket experience, is consistent with Governor Pastikas view that Bali should be an expensive destination but it is incongruous for the opulence of  the Ayu resort to be in stark contrast with the poor roads, poor infrastructure and obvious poverty over the fence.

With electricity and good mobile phone/internet reception Toya Bungkah is already not that weird "other world" I experienced in 1980 but increased development would mean losing some of the current atmosphere in the same way as Kuta has lost the atmosphere it had in 1980, as visitor numbers increased. Locals would welcome better roads and increased opportunities. Most visitors coming up for the day from Ubud probably wouldn't notice what was lost. While Kuta sadly destroyed much of its natural beauty as it developed a different sort of magic has emerged from the mayhem and the Kintamani region could develop its own different sort of magic and even maintain it's awesome natural assets.

The Positives

In 1980 when I first visited, Batur was pristine, probably because visitation was infrequent. On intermediate trips it was a free for all, covered in rubbish. Today it is clean, neat and not overbuilt. Someone must be responsible for this improvement and the new hot springs provide a facility rivalling that available to Toya Bungkah residents back in 1980. The guiding cartel at least benefits locals rather than absentee landlords.

What To Do - Specifics

I've climbed without a guide as have others. The hassles will be at the base of the climb. Once you get part way up you are unlikely to have trouble and drink sellers may offer unofficial guiding services.

You will need a flash light which can be purchased cheaply, some warm clothing and ideally rain protection.

If you are self driving/riding avoid vehicle damage by leaving your vehicle at the hotel rather than the car park at the base of the climb. One guy who suffered vehicle damage thought the cost of tyre repairs was still a bargain compared to guiding fees. Gentle persuasion will be tried first and be prepared for a forceful discussion and to resist strong demands. Some people have reported violence and though I experience fear arguing with strangers in the dark I don't think it usually gets too violent; or else I've been lucky. You might not get much immediate help in a confrontation but extreme violence seems unlikely and I've not heard of robbery. Confrontation is unpleasant and leaves a bad taste but once on the mountain a nice camaraderie develops and even the guiding fraternity seems not to hold a grudge.

Be careful looking down the 150 metres into the crater from the precipice near the bat cave (see the map) as at least one tourist fell to their death. I wouldn't want to be having an argument on this unfenced precipice.

Most of all, enjoy the experience because the view is great after it's earned and there's lots to do and see along the way.

Further Reading

  1. Image galleries showing beautiful images of Batur,  beautiful images of the surrounding area, and most interestingly changes from 1967  around Batur including changes in the shape of the cone due to lava emitted from Batur's frequent eruptions.
  2. Image sets showing  Gunung Batur - in the past,  a Gunung Batur climb from 2005,  Batur and Trunyan in 2009 and  Climbing Gunung Batur recently.
  3. Lots of traveller reviews of Batur and surrounding areas on Trip Advisor.
  4. Wikitravel guide to Kintamani.

Tuesday, May 15, 2012

UCI Bans Race Tracking Until Further Notice

Bicycle race tracking has been growing. Data presentation is still in its infancy but it has already been exciting to watch power and heart rate live in major competitions. Watching the Giro d’Italia on Saturday night I looked for some tracking and there wasn't any. Now I know why, the UCI has banned it, advising National Federations in a note issued two days into the Giro. On the TV it was a real buzz to watch someone I'd met,Fumiyuku Beppu in the breakaway for much of the seventh stage. I wondered how the rest of Green Edge were faring but back in the peloton they were mostly invisible. The commentators said Green Edge had a rider in the breakaway in Stage 6 as well but it was a wasted effort because they dropped back just as the coverage started.

What The UCI Said

Julien Carron, UCI Technological Coordinator, said  "the UCI thinks that the future of the sport of cycling goes through ...new technologies.. in particular with the localisation of riders during the race and on-board cameras". Is that cool or what, I've previously wondered "Why Isn't Race Tracking Ubiquitous?" and the note reveals that the UCI thinks it will be too.

The crux of  Julien's note though, was that "neither cameras nor GPS tracking systems are allowed in any competition"  until an expert committee presents its conclusions despite that "Exceptions may have been granted in the past on several occasions". Actually I thought live race tracking was pretty common. SRM in particular, tracks lots of events. It's only transmitting data to external parties that is banned, not tracking per se which Julien clarifies by; "Naturally, this ban does not concern the personal use of GPS systems (from which the information is not transmitted to the media, sport directors, organizers, etc.) which remain tolerated until further notice."
So tracking isn't banned, just live tracking.
I'm wondering what the context of the note is. Why are they banning race tracking now, its been happening since the 2009 Tour de France? Did it become an issue with tracking the Giro, has there been some other recent development?  Why not let race tracking continue in an adhoc way until the expert committee has figured out how to do it better.  It was also a surprise to learn the tracking system I deployed in the Tour Down Under was an exception. I'd assumed that being approved once it  would be OK for future events. I wonder how you get to be on the expert committee, does tracking a race previously qualify you?

The Reaction So Far

I've searched the internet for answers to these weighty questions but come up blank. The disquiet over banning race radios continues, most recently expressed in twitter comments from two prominent sporting directors.
Riders communicating between each other w/ tam tams & smoke signals in radio-prohibited . Professional cycling at its best!
Well, end result was good, but the lack of radios makes racing so silly. Heck, don't give me a radio, just let the riders talk to each other

Race radios were discussed a while ago at The Inner Ring and Cycling News reports that Stephen Roche, one of several UCI backed representatives on the board of the Professional Cycling Council (CCP) is "trying to upgrade the image of cycling".  Roche's main bugbears are team cars helping riders back onto their bikes after toilet breaks or mechanical problems; riders unzipping their jerseys; and the use of team radios.  So no mention of race tracking there. The UCI has declared the approval protocol for frames and forks to be a successful process and are extending the label to cover other bike components, starting with wheels. Race tracking equipment is not mentioned but perhaps it will have to be labelled "UCI approved" in future also. I'm sceptical of the value of helmet cam video where there is already motorbike mounted cameras but that part of Julien's note has got some discussion previously, most notably when helmet cams were banned part way through last years Tour of California. However, I can't find anything on race tracking so into the vacuum I'll inject some thoughts.

Visualising Tracking Data

The potential for live tracking is huge. The vast majority of races are without helicopters and cameras on motorbikes. Tracking these races and overlaying the data onto simulated terrain or pre-existing imagery like street view can provide pretty good coverage at very low cost.

Experiments in techniques for visualising rides with tracking data acquired on a Green Edge training camp 

The 2012Women's Tour of New Zealand provided almost no coverage beyond final results so as far as I'm aware the simulation below, built from race tracking data is the only race video of the event.

Highlights of the 2012 Womens Tour of New Zealand - Stage 3 built with tracking data from 4 riders.

Another approach is to overlay data onto existing video. Using video of Simon Gerran's 2012 Milan San Remo win from youtube and tracking data provided through SRM, graphics are overlayed onto the video by SUFFERvision.


Overlaying data onto video or producing video from tracking data will probably get the most traction in the short term. But data driven simulators can offer more. As an example, imagine the driving simulator below driven by tracking data.

Travelling from Australian National University, Canberra to Parliament House using an open source driving simulator. If you have a Google Earth browser plug-in installed give it a try.
With video you are limited to the perspective of the camera but with full simulations you can watch the race from any perspective and I could have kept an eye on the rest of Green Edge in the Giro stage 7.

Going further, you can take the live race data and project forward in time as well. That would allow you to drive simulations like the popular Pro Cycling Manager with real data and allow viewers to try their hand as a race director during the race. The possibilities are endless.

A simulation game where you play the role of the team director could be driven from live data.


How Race Tracking Could Be Improved?

I expect that a better common understanding would make race tactics more visible and the race more interesting to all. So allowing everyone to see more could be a good strategy.

Until now only a few riders in each race have been tracked. This has great novelty value but is not enough to understand a race. Each extra rider that is tracked increases the value of the information from the existing tracked riders by providing context. A rider speeding up or slowing down means little unless you know they are in a breakaway, crossing a gap or dropping back.

Location data is not controversial. Riders don't usually mind revealing where they are. Therefore the UCI should aim to provide live location data for all riders as soon as possible but if it's compulsory any rider that doesn't want to be tracked can probably find a way to make their tracker fail. Heart rate and power will add interest but it's controversial. Some riders have been happy to supply power and heart rate data, so make it voluntary and see what emerges. Interestingly riders don't necessarily have any say in who sees their power data. All the power meters and most heart rate monitors transmit their data using ANT+ technology which, unlike bluetooth, provides no security. I know of one developer who is building an application to collect heart rate and power data from all nearby riders and as long as the data is not transmitted live I expect Julien's note would allow it's use.

It is early days. Don't stifle innovation.

Separate data delivery and data presentation. I would expect rapid innovation  in the presentation layer from multiple players if the data is easily accessible.

The technical issues surrounding collecting and distributing the data are not trivial. Race tracking data can be expected to get better over time.

Bicycle racing happens on several scales. Most of the time you want to know which group a rider is in and how far that group is off the pace. You want power and heart rate data summarised over significant periods, perhaps for a climb. There are moments, particularly around finishes, sprints and incidents where very detailed data is required to understand what went on. Transmitting high resolution data continuously is too bandwidth intensive so smarts are required on the bike to decide  what needs to be transmitted. All the existing systems are a compromise and transmit the same data regardless of the situation. Mostly more than is useful but in some situations, not enough.

We've tried trackers in the jersey pocket, which was inconvenient to the rider and under the seat which is not the best place for a GPS signal but works OK. I suspect the future is to replace the head unit on the handlebars and provide feedback to riders through the tracker as well. They will then see not only data from the bike but data on race progress. Continuous feedback of time splits would be useful to riders.

At the moment a common strategy for riders not expecting to win is to break away early in the event. Time and again the winner has spent most of the race out of site and unnoticed in the peloton. Race tracking data could be fed into models that are providing live predictions of the race result. These predictions could be quite exciting for viewers and the predictions themselves will probably change the race as riders will change there behaviour based on the likely outcome. Riders are doing that now but it's more random than it could be. The motivation for banning race radios is to make racing more exciting through increasing rider ignorance. This is almost the opposite approach of making racing more exciting by reducing viewer ignorance. It is probably impossible to keep the audience informed and the riders ignorant.

All of the existing live tracking systems are crude compared to what can be done. I've presented some ideas on what I think will emerge but amongst those with whom I communicate there are differing opinions on what form race tracking will eventually take and what technology to build it with. It is too early for a consensus to have emerged.

Could The Tour Down Under Be First?

I am hoping the Tour Down Under in 2013 will be the first race to comprehensively track the field. The UCI expert committee should have completed their deliberations by then.

A method that could work is to issue riders at pre race sign on with under seat trackers, similar to those we used in 2012, and collect them at the end.

The tracker under Jay McCarthy's seat can be seen in the scene just after Jay's easy win in a 2012 king of the mountain section.

Riders that are willing, can can link the trackers to their power meters, speed sensors and heart rate monitors as well.  The race data could then be made available through an official application, a data stream for third party presentation and hopefully overlaid on TV telecasts.

Monday, April 30, 2012

Activity Logging

Avocado Activity Classifier has now been published in Google Play. It uses the handset accelerometers to classify activities by type and quantify aerobic intensity in MET. Data is uploaded live to Google Fusion Tables.
Activity logging can be used to:-
  • Provide information on total exercise, health and activity levels.
  • Automate exercise tracking.
  • Infer further lifestyle information by combining with other information sources, for example location data.

How Much Time Do I Spend In Each Activity?

Using the Activities_Summary Fusion Table we can discover what proportion of time is spent on each activity. First we aggregate by activity and sum the time, then visualise the data with a pie chart, get the embeddable code and paste it into a web page or blog to give Figure 1.
Figure 1 Activity distribution for all time, updated every time the page is viewed.

Figure 1 is a live SVG graph which changes as the underlying data changes. It is nicely interactive but will not display on most Android web browers so it can be also be turned into the static image of figure 2 which will not update.
Figure 2 Activity distribution up to 26 April 2012 as a static image.
To get useful data, phone activities need to be separated from user activities. A large portion of the day the phone is charging, mostly overnight when I'm asleep. On average several hours a day the handset is detected as uncarried, mostly when I'm at home. As I'm not carrying it, the handset provides no information on my activities during this time but they would be mostly sedentary. Figure 2 is influenced by me being sick for a week so over time it should deviate from Figure 1.  A depressingly small amount of my average day is spent running but I do commute by bike. At the moment this is classified as walking so is included in my walking figure. This will change in the future. I try to walk every day and this is reflected in the data. The rest of the average day I'm stationary which includes standing and sitting but in my case is mostly sitting.

Activity Distribution For A Particular Period

The aggregated data can be filtered for a particular period as shown in figure 3.
Figure 3 Activity distribution 14th - 16th of April when I was healthy.

This period is included in Figure 2 but I managed more walking and running in these few days than the average. These are reasonable activity levels to aspire to.

Activity Distribution For The Last 'n' Days

Until now the query for the data to be plotted was built by selecting options in the fusion table interface and the embeddable html this generated was pasted into this page. This hasn't required any programming but by adding a little JavaScript we can make the data to be plotted user configurable. As an example, take the embeddable code generated in the fusion table interface for the particular period shown in figure 3 and change the date filter value from a constant to a variable. Then provide a text box to capture user input. The JavaScript updates the query variable with the user input and sends the query to recreate the graph. The result, an activity distribution for the previous user chosen, number of days, is shown in figure 4. The JavaScript can be seen and copied from the page source beginning at //Example begins here// and ending at
This is where a graph goes.
Previous days to include: Days:
Figure 4 Distribution of activities from today for a user configurable number of days.
//Example ends here//

Using figure 4 I can check if I am currently achieving the average daily walking times to which I aspire, shown in figure 3 .

Average MET For Each Activity

Sitting on the couch watching the TV gives a MET of 1 in contrast to, say, jogging which can require 7 times more energy.  Step counting with a pedometer is often used to quantify exercise levels as the sensors are cheap and everyone understands steps, but MET  is a better standard for quantifying aerobic effort. Metabolic Equivalent of Task (MET), or simply metabolic equivalent, is a measure of the intensity of aerobic exercise.
Aggregating by activity, excluding running, averaging MET and viewing as a line graph gives the result in figure 5.
Figure 5 Average MET for each activity excluding running for all time. All "Uncarried" activities are handset rather than human activities and MET is recorded as 1 because there is no information to show the human is not sedentary.
MET can be measured from accelerometer data quite accurately in most situations but not all. For example, accelerometers will measure the increase in MET with increasing speed but are insensitive to change of grade. It's superior to step counting though, as step count is unaffected by both pace and grade. I like to walk up mountains and try to do so daily so some of my walking will be at a higher than measured MET. My running sample is too small for the MET to be meaningful.

When Does Walking Happen?

You can plot duration versus time for a particular activity. Most of my physical activity is walking so filtering on walking and visualising the result as a zoomable line chart shows when I do it as illustrated in figure 6. Try zooming these graphs or sliding the graph window with the control in the lower window. It is very nice.
Figure 6 Minutes walking versus time shows what time of the day long walks take place

Doing the same thing for MET gives the result in figure 7.

Figure 7 MET while walking versus time.

Comparing figure 6 and figure 7 shows that I get the majority of my aerobic exercise during the long walks. My MET during these walks is double the overall average shown in figure 5 even though it is underestimated when climbing mountains.

Fusion Tables

As demonstrated in the above examples Fusion tables provide a great opportunity to play with your activity data and fine control over what you publish or share with friends. The examples above have links to the graph definitions that can be copied for your own data. Avocado Activity Classifier creates two Fusion Tables; the Activities table which contains a lot of detail and the Activities_Summary which is a subset of the first and intended to be shared.

Battery Consumption

Avocado Activity Classifier runs intermittently in the background whenever the phone is on and will be too inconvenient to use if it consumes significant battery power. The accelerometer, a BMA150, in many handsets is a low power device. If it was configured to transfer data periodically using interupts, battery consumption while activity monitoring could be significantly reduced and somebody will probably sell an Android sports phone one day that does it. Currently AvocadoAC has a 20% duty cycle, sampling 6 seconds out of every 30. Consequently it already draws less from your battery than pedometer apps but we are still searching for the sweet spot. In the test shown in figure 8, power consumption is lower than Cell standby and Phone idle which hopefully is low enough to satisfy most users.
Figure 8 After over 10 hours the battery is still at 80%. Battery consumption in this test is lower than Cell Standby and Phone idle. WiFi was on but not connected and consumed double the power of AvocadoAC.

The effect on battery life for any particular user is highly dependant on use patterns. I usually get through a day OK and recharge every night. Battery consumption is low enough in this case so as not to be noticed. If you don't get through a day on a single charge the battery will fail slightly earlier but it's not likely to be noticed because other things, most likely the display, will be dominating consumption. If you normally go 3-4 days between charging then very little battery is being consumed and you are likely to notice the additional load from Avocado Activity Classifier.

Where Does This Work Fit?

Our overall goal with this work is to monitor exercise and training and make lifestyle, training and tactical race decisions based on data rather than guesswork. The data that could be recorded is almost infinite and the effort to acquire it can easily be greater than the value of the information that it provides. Therefore, data acquisition must require as little human intervention as possible. This requires; methods to detect what data is appropriate for any particular situation, acquiring the minimum necessary, summarising the data as it is recorded and storing the summary in a useful form.  Avocado Activity Classifier is intended to provide a record of exercise and activity data during the course of a day and when a training activity is detected invoke other applications suitable for monitoring specific training activities all without user intervention.

A non market version which uploaded activity data to a centralised repository was made available when the conference paper  Activity Classification With Smart Phones For Sports Activities was published. Since then, the classification algorithm has been changed from K-Nearest Neighbour (KNN) to a Naive Bayes classifier and Activity data is now uploaded to Google Docs Fusion Tables rather than our own repository.

Publication

Ken Taylor, U. A. Abdulla, R. J. N. Helmer, J. Lee, and I. Blanchonette. Activity classification with smart phones for sports activities. In APCST 2011: 5th Asia-Pacific Congress on Sports Technology, Procedia Engineering. RMIT University, Elsevier, August  2011. 162k View Download